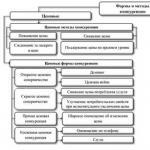
Payback period of the initial investment. Calculation of the payback period of an investment project: main goals
9.3.1 Return on investment (PP) method
The payback period is related to liquidity. This method is focused on short-term assessment, considering how soon the investment project will pay for itself.
To evaluate the project using this method, you must first calculate the amount of net income ( BH). Net income Is the accumulated effect (cash flow balance) for the billing period:
where is the effect (balance) of cash flow on tth step.
The essence of the payback method consists in determining the duration of the shortest period after which the current net income becomes and remains non-negative in the future.
A project is selected:
With the shortest payback period or;
For which the calculated payback period is less than the maximum acceptable (set by the investor arbitrarily).
There are 2 options for calculating the payback period:
1st calculation option:
With an even distribution of income over the years, the payback period is calculated using the formula:
where IC- the amount of the initial investment (initial invested capital);
- the average annual profit from the project.
Example 1.The enterprise is going to purchase new equipment. The cost of purchasing it will amount to 20,000 rubles. It is expected that its use will reduce production costs by 4,000 rubles. in year. The service life of this equipment is 6 years. The company considers investments to be justified if they pay off within 4 years. Should you buy the equipment?
The payback period for this project is 5 years (20,000/4,000). And although the equipment pays for itself during its service life, the project cannot be accepted, since the payback period exceeds the period specified by the investor.
2nd calculation option:
In case of uneven distribution of income, the payback period is calculated by direct calculation of the number of years during which the investment will be repaid with cumulative (cumulative total) income (profit).
Example 2.We use the condition of example 1. However, we will revise the expected savings from the reduction of production costs. We will arrange the initial data and the course of the solution in the form of a table:
|
Years of the "life" of the project |
|||||||
|
1) Initial investment, rub. |
|||||||
|
2) Annual receipts (savings on costs), rub. |
|||||||
|
3) Balance, rub. |
|||||||
|
4) The amount of the accumulated balance, rubles. |
|||||||
The calculation shows that the payback of the project occurs during the fifth year of the "life" of the project. The exact point of the payback period is determined as follows:
- the uncovered balance of the investment amount in 4 years will be 5500 rubles;
-
define the share of the payback period attributable to the uncovered balance of the investment amount: ![]() ;
;
Conclusion: despite the fact that the payback period has slightly decreased compared to the result obtained in example 1, the project will still be rejected as the payback period exceeds the period specified by the investor.
To use the ROI indicator, the following conditions must be met:
All alternative designs have the same lifespan;
All projects assume a one-time initial investment;
The investor receives approximately the same annual cash receipts throughout the life of the investment projects.
Merits method PP are:
Simplicity of calculation;
Accounting for project liquidity.
Method PP has the following disadvantages:
Ignores the temporal aspect of the value of money;
Does not take into account income arising at the end of the payback period;
Projects with equal payback periods, but different temporary income structure are recognized as equal;
Emphasizes the income from the project and the speed of these receipts, rather than the level of profitability or total profit.
However, the payback period method is often used in practice. It can be useful as a general approach to determining the level of liquidity. However, you should not use the payback period criterion as the only indicator for making an investment decision.
| Previous |
Life cycle investment project (IP) consists of five main stages:
- development of an investment project and construction (creation) of an object;
- mastering technologies and reaching full capacity;
- normal operation and return on investment;
- generating additional profit after a one-time payback;
- liquidation and (or) sale of assets.
The criteria for the temporal effectiveness of IP are the minimum duration of the first three stages and the maximum duration of the fourth stage. Widely used 20-50 years ago, the indicator of static payback period (CO) was not related to the time factor: it is indifferent to when the return on investment begins.
When using it, the first two steps life cycle the investment project fell out of the sphere of management and the impact of efficiency calculations, as a result of which there was a risk of their delay and investment freeze. It also did not show the return on investment, since it was not associated with either the service life of fixed assets or their depreciation rate.
This indicator made it possible to determine the effect of using capital investments as part of accumulated funds. The return on investment in reality is carried out in the order of simple reproduction through depreciation deductions. That is, a one-time return of capitalized investment costs (CI) occurs "automatically" even if the actual service life of fixed assets is not less than the duration of the billing period (RP), even with zero profit. In the cash flow methodology, the payback rule is adopted, according to which the payback of an individual entrepreneur occurs due to the accumulation net income (depreciation plus profit). However, when calculating this indicator of the payback period, it should be understood that "simple", i.e. a one-time return in modern conditions is insufficient for expanded reproduction and its fact does not mean that a sufficiently high efficiency of investment costs is provided.
When determining payback from cash flow (net income), the dynamic payback period does not show the real return on investment, since part of the accrued net income is usually spent on current consumption. Therefore, it would be wrong to imagine that by the end of the payback period, return on investment becomes a fact.
Indeed, the rule of payback is fairly conventionally established that "payback" means exactly one hundred percent equality of the income (effect) received to the investments spent or the output of the value of the accrued (calculated on a cumulative basis) net income from minus to plus.
Often in literature payback period, payback period and return on investment are considered synonyms and are also defined uniformly. There are two main names for temporary dynamic performance indicators in various sources: payback period (term of recoupment, recoupment period) and return period (payback period, recovery period)... With a careful approach, this is one and the same indicator, while the concepts of payback and return FROM may not be entirely identical (although in English this is actually the case).
In the process of returning an investment project, several processes can be discerned.
The first - the one that corresponds to the payback rule - is the achievement by the amount of the income received to the value of the investments made. This assumes that income represents net gross profit, but the Investment Performance Appraisal Guide states that it is “incorrect to calculate the payback period based on net income after tax”.
The second process is the return of the invested funds - the possibility of the real withdrawal by the investor of the funds invested in the project back. Therefore, for a deeper analysis, it is quite possible to use several indicators of time efficiency. These indicators will differ from each other depending on how they take into account the following points:
1. What costs should be included in the volume of investments, the payback of which is determined? The payback of only the initial investment is often determined, although it is more correct to take into account additional investments during the period of operation. In addition, sometimes minor expenses related to deferred expenses are not attributed to a one-off (ie investment), but added to current operating expenses. Should I take into account the paid VAT, which is not included in the price? non-current assets, since it has its own mechanism of return - credit, in general, faster than that of capitalized IZ? Real cash flow removes these issues in many ways, but at the stage of business planning, the complex structure of IZ makes it much more difficult to predict this flow. In addition, their solution is important when analyzing the dependence of payback on the structure of IZ. When calculating static CO, the amount of losses was added to the IZ amount before the start of the project, but when using the cash flow method, the planned losses are automatically taken into account.
2. At what expense and how is the payback:
- in accordance with the rule of payback due to the entire amount of net income (NP);
- the part of the NP that remains for accumulation - the real amount that can be withdrawn from the project;
- only at the expense of depreciation charges?
In other words, what is “ROI” as such? At the same time, the option of early closure (sale) of individual entrepreneurs to accelerate payback and return on investment is not considered or remains "in reserve". Withdrawal of investment costs is possible only in the form of free funds coming to the same funds (hands) from which they were financed. Considering this, what point should be recognized as the moment of the actual payback of the IP, i.e., effective?
Here we mean whether it will be a point of one-time return, provided that the payback is determined by the filling of own sources of funding (depreciation fund and accumulation fund), or a point of two or more return, if the payback is determined by net present value (NPV), which is used not only for accumulation, but also for consumption. This difference also takes into account the structure of the IZ. First of all, the fact that part of the IZ, aimed at creating stocks (working capital), can finally be returned (withdrawn from the project) only after its completion: when the leftovers are sold finished products and other reserves (although for the investor it is not so important what the returned amount consists of). Meanwhile, in projects starting with capital construction (plant, workshop) in an economic way, the payback in the form of amortization accumulation begins even before the facility is put into operation and the start of product sales along with the accrual of depreciation on construction equipment. The role of the circulation of working capital (i.e., part of the total investment) in the payback process has yet to be clarified.
3. How is the starting point (base point) of the payback period determined? - left on the timeline (see figure 1)? In this respect, most of the methods and researchers suffer from carelessness, as if everything here has long been unambiguous. It is taken as both "the moment specified in the task for calculating efficiency", and the beginning of the RP (without specifying whether this is the beginning or the end of the zero step), and "the beginning of the development of investments" (which point is, you can answer in different ways), and even the beginning of "working off" (as in the concept of static CO). This can partly be explained by the fact that "period" is translated from English as "cycle, circle" and "point". That is, it is more important for someone to determine the payback point, and not the payback period itself. But without finding the duration of the period, it is impossible to compare different projects (options) in terms of speed (time) payback.
Figure 1. Life cycle and indicators of return on investment project
Time in billing period is counted from a fixed moment taken as the base period. This is most often the beginning of step zero, but it may also be the end of it. In the latter case, it is more correct to discount cash flowsas they are listed at the end of each step. The most accurate approach here is that the left point should be determined by calculation, taking into account the distribution of investments at the first stages of IP.
According to the payback rule, the right-hand point of the payback period (roughly) is at the step (year) t ", which is found when solving the transcendental equation (1):

The analysis of the data given in Table 1 shows that the right point of the CO lies within the tenth step, when the value of NPDD (the last column) changes sign from “-” to “+”.
Table 1. Calculation of IP efficiency (Nd \u003d 15%)
| Step number | Cash flow indicators | |||||||
|---|---|---|---|---|---|---|---|---|
| Kt | Pt | at | Kt at | Pt at | BHt | NCHD | NCHDD | |
| 1 | 50 | 0 | 1 | 50 | -50 | -50 | -50 | |
| 2 | 880 | 0 | 0,87 | 765 | -880 | -930 | -815,2 | |
| 3 | 121 | 0 | 0,756 | 91,5 | -121 | -1051 | -906,7 | |
| 4 | 0 | 250 | 0,658 | 0 | 164,4 | 250 | -801 | -742,3 |
| 5 | 0 | 350 | 0,572 | 0 | 200,1 | 350 | -451 | -542,2 |
| 6 | 0 | 350 | 0,497 | 0 | 174 | 350 | -101 | -368,2 |
| 7 | 0 | 350 | 0,432 | 0 | 151,3 | 350 | 249 | -216,9 |
| 8 | 0 | 350 | 0,376 | 0 | 131,6 | 350 | 599 | -85,3 |
| 9 | 0 | 200 | 0,327 | 0 | 65,4 | 200 | 799 | -19,9 |
| 10 | -200 | 100 | 0,284 | -56,9 | 28,4 | 300 | 1099 | 65,3 |
| Total | 851 | 1950 | 849,9 | 915,2 | 1099 | |||
| Initial investment return index | 1,07 | |||||||
| Return on total investment index | 1,08 | |||||||
NPD is the nominal cumulative net income;
NCHDD - discounted net income on an accrual basis.
The first one can be called the full payback period, since it additionally takes into account the time spent on the diversion of funds in construction (if any), the period of freezing IZ before the start of return and the period of "working off". The left extreme point on the time scale can be fixed in two ways, either by the base, or by some "central" moment of the FROM.
The second indicator is CO, the left extreme point of which is the beginning of the project's return (or the moment of the last investment).
The first and second indicators are calculated in typical investment projects and in terms of equity capital and are best suited to the case when the investor and the seller are one and the same person.
A typical investment project is a project in which typical (most frequent) cash flows occur: first there is a period of investment, then a period of return without investment costs, and at the end the liquidation value of assets is taken into account. That is, in typical investment projects, the sequence and lag between investment and return are mandatory.
For the third indicator (let's call it the return period - PV), the left point is one of those considered above (here it is not so important), and the right one is the return point (TB) tв is determined by equality (2):

The return period is determined by the period for which the amount of free funds will be received, equal in size to the original IZ, and these funds could be used for further investments both in this project and for any others. In terms of its value, PV is always greater than CO, since the right side of formula (1) is always larger than the right side of formula (2). The sum SUM (Аt + Pчнt) is the capital share of NPV (capitalized income).
The return period indicator characterizes the feasibility of the individual entrepreneur from the standpoint of the timely and full return of the advanced funds, taking into account the interest rates on the loan. The real value of PV is always of interest to a third-party investor, as well as a creditor bank, which decides to lend to the implementation of this project, or the enterprise itself, financing it from its funds and planning its further investments. (In practice, banks do not calculate RO, since they do not yet know the theory and methodology for calculating it.) If the project is 100% implemented at the expense of a loan, then the RO value will indicate the minimum loan term required to return it. Thus, in the latter case, calculating the return period is a possible way to solve the problem of determining the financial feasibility of the project. The concept of the return period of investment, in contrast to the concept of one-time CO, takes into account the time, income and expenses that occur both before and after the payback point, is based on actual date service of fixed assets.
The rest of the indicators of CO and PV have a lot in common. Both are dynamic indicators, although they can be either nominal or discounted.
The use of dynamic CRM allows, as you know, to cover in the calculation the main stages of the life cycle of an investment project, including design, creation, implementation and development of an object, as well as its operation and receiving returns until the moment of a single return (or payback). Accordingly, CO can be represented as the sum of several terms. Analysis of the actual structure of CO allows to reveal the reasons for its deviation from the calculated value. When calculating CO and PV, it is necessary to take into account the lag between the implementation of capital investments and the beginning of the effect.
The calculation of CO and RO should start with the calculation of the central moment of the investment. It is necessary to find the left point of the RP, which characterizes the central moment of investment (the "center of gravity" of this process). If we take the moment of the first investment for it, then in some cases a strong lengthening of the term will be obtained.
For example, at the initial stage, a deposit (the first part of the investment) was paid for participation in the tender (about 1% of the order value). The tender was won, but the results were approved with some delay. The implementation of the investment project and the main purchases (investments) occurred not even in the second or third, but in the fourth and fifth steps. Then the payback period, if you start counting it from the first investment, in this case will increase by several steps (years) of the forced expectation from the first investment to their main part.
To calculate the discounted CRM, two assumptions must be made. First, the investment of each step belongs to its middle (shown in the middle). Second, the resulting effect (NPV) is distributed evenly within the RP step at which the value of the increased NPV changes sign from “-” to “+”.
These assumptions contradict the initial assumption when calculating NPV that discounting brings all calculated values \u200b\u200bto the end of the step and will somewhat affect the accuracy of the CRM calculation. When calculating undiscounted CRM, these assumptions are the most acceptable. Generally speaking, it is advisable to discount in all cases by the middle of a step, in this case the least error will be ensured.
So, for an accurate calculation, it is necessary to bring all point investments for the project to one point, which can be called a central or dynamic investment center (CI). TI refers to a point within the investment phase, which is a conditional point on the time scale, in which all the moments of investment are summarized (recall, it is conventionally accepted that all investments of this step belong to its middle). Accordingly, the weighting factor for the first step is 0.5, for the second - 1.5, for the third - 2.5, etc.
If necessary, refined calculations, the point of investment can be determined taking into account the quarterly or monthly distribution of IZ during the period of the object creation.
In those cases when the beginning of the zero step is taken as the base moment, the central moment (point) of the DI investment is determined by the formula (3):

Consider an example (table No. 2) of determining the dynamic investment center CI \u003d (66 * 0.5 + 58.8 * 1.5) / (66 + 60) \u003d 0.97 (step, year).
Table 2. Calculated table for determining indicators of CO and PV (all indicators are discounted), mln. Rubles.
| T | Inflows by main activity | Inflows by financial activities | Investment costs | Transaction costs | NPV | Capitalized NPV | Increased NPV | Balance KChDD |
| 1 | 0 | 66 | -66 | -66 | -66 | |||
| 2 | 0 | 58,8 | -58,8 | -124,8 | -124,8 | |||
| 3 | 113,636 | 20 | 77,273 | 56,363 | 36,64 | -68,435 | -88,16 | |
| 4 | 104,132 | 18,182 | 69,421 | 52,893 | 34,38 | -15,542 | -53,78 | |
| 5 | 90,158 | 15,026 | 60,856 | 44,328 | 28,81 | 28,784 | -24,97 | |
| 6 | 78,984 | 6,83 | 48,494 | 37,32 | 24,97 | 66,104 | 0 | |
| Total | 386,91 | 60,038 | 124,8 | 256,044 | 66,104 | 124,8 |
There are two practical methods for further calculating the CO: using numerical mathematics and using a special simple algorithm for calculating the integral effect (NPV). When determining the NPV (Table 2), the ordinal step (year) t of the calculation period is algorithmically identified, at which the value of the accumulated NPV changes sign from “-” to the sign “+”. Its number will show the payback point rounded up t ". In fact, it lies within this step. From it to the end of the step, there is a segment equal to NPVDt" / NPVt (fractions of a step). The exact value of the payback point of TO (taking into account the above assumptions) can be found by the formula (4):
TO \u003d t "- НЧДДt" / ЧДДt "
Let us consider in more detail t "\u003d 5 (Table 2), NPVD \u003d 28.784 million rubles, NPV \u003d 44.328 million rubles.
The exact value of the payback point for TO will be 5 - 28.784 / 44.328 \u003d 4.35. Figure 1 shows that the period required to generate NPPD \u003d 28.784 million rubles was 0.65 steps (years).
The location of the TV return point (the right point of the return period and the payback point) does not depend on where the left point was taken: in the first investment, at the beginning of the RP, or others.
As a result, the assessment of the values \u200b\u200bof the payback period (CO) is determined using the formula (5):
CO \u003d TO - QI
The determination of the return period (RO) is carried out accordingly using the formula (6):
PV \u003d TV - CI
In the above example, CO \u003d 4.35 - 0.97 \u003d 3.38 (steps, years).
PV \u003d 6 - 0.97 \u003d 5.03 (steps, years). The return point coincidentally coincided with the end of the 6th step.
The double refund period ends at the 8th year of the RP.
PV \u003d 8 - (135.674 - 124.8) / 124.8 - 0.97 \u003d 6.93 (years).
Figure 1 shows that the period of working out for CO is 2.35 steps, and the not shown period for working off for PV is exactly 4 steps.
When analyzing IP and time efficiency indicators, it should be borne in mind that the heterogeneity of various parts of investment costs is accompanied by the risk of their return to varying degrees. Any IZ item is equally effective in terms of the amount of profit it brings, but only depreciable costs create a depreciation fund and reduce the taxable base for income tax. VAT that is not included in the original cost of non-current assets has a credit return mechanism. Investments in working capital gains are also returned with each turnover, and can finally be released (returned) only when the project is liquidated.
Literature:
- Investment Performance Assessment Guide. UNIDO, 1978.
- Serov V.N. On improving the assessment of the economic efficiency of investments in production capital // Investments in Russia. - 2008. - No. 7.
- Chistov L.M. Construction economics. - SPb., 2000.
Studying proposals for investing money in any undertaking, the investor must have analytical tools to determine the prospects of the project, the level of its future profitability. However, the generated profit is only a part of the analytics, the most complete picture is provided by such an indicator as the profitability of the project.
Why shouldn't profit be considered the only criterion for the success of an initiative? The fact is that enterprises with completely different indicators of the amounts of working capital and fixed assets can show an equal rate of return. Consequently, with equal profits, the company with a lower value of production assets can be considered more efficient.
Thus, it can be concluded that profitability is an absolute measure. Project profitability is a relative indicator characterizing the economic efficiency of using all available resources (monetary, labor and material). Its final expression is often expressed as a percentage. Any self-respecting businessman should know how to calculate profitability.
There are a number of different types of ROI, notably sales, equity capital, assets, fixed assets, production, personnel, capital employed, etc. Enterprise profitability can be improved in several ways:
- increase in production and sales of products, and, consequently, profits;
- reduction in production costs;
- saving raw materials;
- more rational use of equipment;
- increasing the level of labor productivity;
- avoidance of downtime.
Calculating the profitability of a project is not an easy task. When evaluating the proposed investment project, a number of indicators are considered, such as:
- NPV (net investment project value);
- PI (return on investment);
- IRR (internal rate of return);
- PP (DPP) is the payback period.
The last indicator (payback period) is more often perceived as informative and auxiliary, and becomes decisive only when the main indicators of the alternative projects under consideration are approximately equal. In this case, the rate of return on investment comes out on top.
How to determine when a project will pay off
One of the most visual and easily calculable indicators of the feasibility of the investment is the payback period of the project. It shows the investor with high accuracy (up to months and even days) the period for which his money will return to him, after which it will start to make a profit. The payback of the project becomes one of the most important factors when choosing between several options for the proposed initiatives: the lower its value, the better. The sooner the money is returned, the faster it can be re-invested, while the risks are reduced.
This is especially true in light of a breakthrough in new technologies, incl. computer, as a result of which many products become obsolete very quickly and lose their competitiveness in the market. It is necessary to invest money and have time to get profit from them until this happens.
The calculation of the payback period is based on the ratio of the initial investment in the undertaking and its average annual return. It is also convenient because in the presence of several investors, each, knowing his share, can calculate the payback period in relation to his situation.
The formula by which the calculations are made is very simple and looks like this:

- PP - payback time (number of years);
- Io - the amount of initial investment in the project (in monetary units);
- CFcr - average annual income (in monetary terms).
However, it is often impossible to calculate the size of the average annual income. In this case, there is another way to calculate the payback of projects:

in in this case:
- CFt is the income of the undertaking in the t-th year;
- n - number of time periods (years).
Let's consider these statements with a simple example. The businessman invested 400 thousand dollars in a startup. How to find out how long it will take to get the money back and make a profit, if income by years is expected in the following volume:
- 1 year - $ 70,000;
- Year 2 - $ 150,000;
- 3 years and all subsequent years - $ 200,000 each.
First you need to tackle the definition of the average annual income. Adding the values \u200b\u200bof income for the first two years (70,000 + 150,000 \u003d 220,000), we see that they are less than the initial investment, therefore, the indicator of the third year must also be added:
CFcr \u003d (70,000 + 150,000 + 200,000) / 3 \u003d 140,000
PP \u003d 400,000 / 140,000 \u003d 2.857 years
 Consequently, based on the calculated indicators, the undertaking will pay off in less than 3 years (more precisely, in 2 years and 10 months), after which it will be profitable. It is very convenient to determine this kind of indicators using MS Excel.
However, not all so simple. The formulas above do not account for the change in the value of money over time, so the results may be skewed. The price of money can change at different rates, depending on the economic and political stability in the world or a particular country, the level of inflation, interest rates on loans, etc.
Consequently, a more objective picture can be given by bringing future money flows to the current state, that is, discounting the indicator. This is done using the formula DPP \u003d n, if a

wherein:
- DPP - payback time taking into account changes in the value of money;
- CFt is the amount of income for a certain period of time;
- Io - the amount of the initial investment;
- r - interest rate (discount factor), which can be found from a special table of factors.
Let's go back to the previous example, but introduce an annual discount rate of 10%. You should recalculate receipts by year:
- 1 year - 70,000 / (1 + 0.1) \u003d 63,636 dollars;
- 2 years - 150,000 / (1 + 0.1) \u003d 135363 dollars;
- 3 years - 200,000 / (1 + 0.1) \u003d 181,818 dollars.
The total income of the first three years will be $ 380,817, which does not cover the initial investment, therefore, it is necessary to calculate based on a cycle longer than three years:
CFcr \u003d (63636 + 135363 + 181818) / 3 \u003d 126939
DPP \u003d 400000/126939 \u003d 3.151 years
In this case, taking into account the discount rate, the initiative will pay off in 3, 151 years, or in 3 years and 2 months.
Given the rule that money always gets cheaper over time, it can be understood that the calculation of the payback taking into account discounting will always give a large value, that is, the payback period will increase.
The payback indicator, for all its advantages, has serious disadvantages. In particular, it does not take into account the flows of money that will be generated after the moment of return on investment. Also, the duration of the payback period is influenced by downtime (forced or technological). During construction, there is often a multi-month gap in time between the pre-investment costs and the costs of construction and installation work.
Also, the considered formulas do not take into account the need for additional investment of funds directly in the process of implementing the initiative for various overhead or operating expenses. To improve the accuracy of the calculations, some experts prefer to use the average annual profit value in the formula instead of the average annual income.
The Role of Internal Rate of Return
One of the most important indicators of the prospects of an investment project is the internal rate of return, which in international practice denoted as IRR. It represents the rate of profit that is generated monetary investment... This is the size of the discount rate that ensures the equality of discounted income and investment. In other words, at this value of the barrier rate, the current value of the investment is zero.
Knowing the IRR allows you to find out the maximum value of money at which the profitability of the undertaking is maintained.
The calculations here are rather complicated, therefore, to find the value of such a discount rate, specialized programs (such as Excel) are usually used, or a graph is built showing the dependence of NPV on the discount rate. IRR is received as a discount rate when zero value NPV.
If the internal rate of return is higher than the total cost of capital, then such an initiative can be considered, otherwise it is rejected. Suppose, as a result of the calculations, the IRR turned out to be 12%, therefore, with an average weighted cost of capital invested of 10%, the project seems to be profitable.
This criterion has its strengths and weak sides... Its positive quality is the ability to compare initiatives of different sizes and durations. The disadvantages include ignoring reinvestment, as well as the inability to express it in absolute terms (in monetary units). In addition, for some values \u200b\u200bof the initial data, you can get several different IRR values \u200b\u200bor not be able to calculate it at all.
The payback period of the project is one of the key indicators of investment efficiency, by which you can determine their feasibility, choose between several investment objects. Read, by what formulas it is calculated, how to evaluate it using the investment modeling method, and also see examples of calculation.
What is this article about:
What is the payback period of the project
The payback period is one of the most common and understandable indicators for evaluating the effectiveness of investment projects ... We often talk about the return on investment in equipment, software, land and information resources to justify a decision to purchase a resource or implement a project. This is understandable. Everyone wants to make the most of their investments.
The payback period of an investment project is the period of time for which the net income on an accrual basis will become zero. The notation PBP from English is often used. Pay Back Period. In other words, this indicator serves as a tipping point between negative and positive net income. The zone of positive net income is the profit zone for which the investment project was started. Let us visualize the indicator of the payback period on the cash flow graph (see Fig. 1).
Picture 1... Payback time on the cash flow chart

In the figure, the payback period of the project is approximately 13.5 investment steps. These can be different periods - a month, a quarter, a year, according to the results of which an intermediate summing up of the costs incurred and the income received is carried out.
Download and take to work:
How will help : the document contains the principles and methods of investment planning. It fixes uniform rules for managing investment projects and the procedure for their initiation, a methodology for assessing their effectiveness. This will help to avoid unnecessary costs and increase the efficiency of use. capital investments.
Payback point of an investment project
Going from negative net cash flow to the positive is called the payback point of the investment project.
The advantages of calculating the payback period are as follows:
- Ease of calculation if alternative projects are ranked, ceteris paribus.
- The calculation can be made quickly "on the knee" without taking into account the factor of changes in money over time (discounting).
- The rate of return is set in the company, which gives a minimum of error and inaccuracies of calculations when discounting.
The formula for calculating the payback period of the project
Basic formula (1) for calculating the payback period PP:

where: I - sum investment investments to the project,
CF - discounted cash receipts from the investment project.
How to accurately calculate the payback period of an investment project using Excel
To quickly and accurately determine the ROI period in Excel, you need:
Understand what initial data and in what form will be required for calculations;
- develop a special form in Excel.
Interpretation of payback values
The payback period is difficult to interpret. There is a rule: the project with a shorter payback period is more effective. However, what will happen to financial results and income after the deadline, the criterion does not reveal. Therefore, additional analysis of other significant criteria for the effectiveness of an investment project is required.
It should be remembered that serious strategic projects have long payback periods, therefore this indicator is a good auxiliary, but not the only criterion. However, an operational analysis should definitely start with the question of the return on investment.
Note that to calculate the payback period, you need to know the exact quantitative values \u200b\u200bof investments and generated cash flows for each reporting periodgiven to the current date. In practice, it often turns out that the conditions of the company's financial activities have changed, economic environment does not correspond to the planned realities, cash receipts from the new product deviated more or less than the acceptable 5% deviation. As a result, the payback period is significantly increased.
How will help: develop a comprehensive methodology for the regular assessment and analysis of investment projects.
How will help: to establish procedures for monitoring the effectiveness and risks of investment projects.
Video. The procedure for calculating the payback period
Simple payback period (PBP) - the minimum integer number of years (periods) during which the accumulated cash flows steadily reach a value not less than the initial investment. The discounted payback period (DPP) is used to track money over time. That is, 500 rubles in a year is not the same as the same 500 rubles today. How to count them, the video tells Benedict Wagner, CEO of Wagner & Experts. You can learn more about all methods of evaluating investments in ... This topic is devoted to .
How to take into account the factor of environmental variability
Conduct an accurate analysis of all receipts and costs during the implementation of the project, ensure the reliability of the sources of receipt of the cash flow of the investment project. This option involves the conduct of an aggressive financial policy, time and labor costs for the analysis of each business transaction for compliance with the budget. In addition, the company is not immune from the influence of inflation on the change in the value of money over time.
You can use the method of simulation of the external environment to estimate the payback period of the project. This method is more flexible in terms of precise cash receipts, since we set a certain range of values \u200b\u200band consider random market processes of changes in the business and macro environment.
Simulation method for analyzing the payback period
"The future is impossible to predict, but this is our job" - these words very accurately describe the method of simulation. Simulation modeling is a convenient tool for analyzing the payback period - it is visual, easy to understand and check. Its use in work serves as a kind of lifesaver for top management.
5 Key Benefits of Simulation for Estimating ROI
- Wide variability of future development scenarios.
- Quick calculations using MS Excel.
- High assessment of the predicted result.
- The independence of the decision-makers in the company.
- Graphical presentation of the result.
The essence of the method is that the initial static model is supplemented with a range of variable data - this is how we automatically model the market and possible financial conditions... For this approach, investments and cash flows should be evaluated in terms of the minimum and maximum values \u200b\u200bassumed. The more scenarios are developed and calculated, the more accurate it will be financial results - in our case, the payback period.
To make it clearer, consider using an example of assessing the payback period of a project using the simulation method.
How will help: Provides guidance on how to validate the original financial model data to ensure that the calculations and forecasts are realistic.
How will help: when planning an investment project, it is important to correctly assess the competitiveness of a new product and its market prospects. This solution will help to take into account the forecast of the market situation and possible risks in the sales plan.
An example of calculating the payback period of a project
According to the financial department, investments in expensive equipment range from 1,300 to 2,000 million rubles, depending on the dollar exchange rate and the results of procurement tenders. The management of the company expects that the following cash flows will be generated with the full utilization of production facilities (see Table 1).
Table 1. Predictive research on the purchase of equipment
|
Indicator |
Value |
|
|---|---|---|
|
Internal rate of return,% |
||
|
Investment costs for the project year 0 (mln rubles) |
||
Let's estimate the payback period of investments in the purchase of equipment. The risk indicator in this case for the company's management is the payback time of the equipment over 5 years.
Let's calculate the payback period using methods that allow us to find the range of values \u200b\u200bof the indicator of interest by the intervals of values \u200b\u200bof the incoming data.
We randomly select the value of the cash flow using a random number generator in MS Excel. In MS Excel, the function RAND () is provided for this. It returns an arbitrary value from the interval we specified. We get one of the scenarios for the development of the market environment for each year of the project.
Let me remind you that the intervals of change in the values \u200b\u200bof the cash flow are provided by the financial and economic block of the company.
Repeating these steps, we carry out several hundred experiments in Excel using the same RAND () function. We get a set of values \u200b\u200bof the indicator of interest to us (the payback period of the project).
Summarizing the theory, we will build a table of totals (Table 2).
For example, in scenario 1, the payback period will be:

We get that the criterion of project implementation (more than 5 years) in this scenario does not suit the company's management. Let's move on to the next scenario and so on. Let's create 10 thousand lines.
table 2... Simulation calculation
|
Scenario # |
Investment costs (million rubles) |
Cash flow for the project year 1 (mln rubles) |
Cash flow for the project year 2 (mln rubles) |
Cash flow for the project year 3 (million rubles) |
Cash flow for the project year 4 (mln rubles) |
Payback period at a given rate of return |
Exceeds the payback period set by management? |
|---|---|---|---|---|---|---|---|
|
± 10% (deviation from interval) |
from 1300 to 2000 |
from 350 to 500 |
from 450 to 480 |
from 550 to 650 |
from 150 to 600 |
over 5 years |
|
Let's present the results graphically (Figure 2).
Picture 2... Analysis of the obtained payback periods under various scenarios

Based on the simulation results, we can predict: approximately 12% of the risk is the equipment purchase project, in this scenario, the payback period of the project is more than 5.5 years. In addition, there is a 4% chance of a rapid return on investment, less than 3.5 years.
There is about 80% chance that the payback period will be from 3.5 to 5.5 years. This is a high assessment of the success of the project on time for the company's management. Thus, we managed to recoup the investment in the equipment in 5 years.
Thanks to a new approach to assessing the payback period of investments, an analysis of the investment project was carried out using the method of simulation modeling, the probabilistic value of the payback period of the project was obtained and the risk of its implementation was assessed.
How to choose a bank to implement an investment project
To implement the investment project, the company will need a partner bank. His choice should be approached very meticulously. After all, the well-being of clients largely depends on the state of the servicing bank and the level of its current liquidity. It is necessary not only to carefully choose a bank, but also then to monitor its financial condition in the course of work, taking into account the range of services provided and their cost, the bank's rating, specialized focus, successful experience and competence in the implementation of similar projects.
findings
It is better to start analyzing a project from the simplest thing - from the terms of the refund. The main advantages of analyzing payback periods are simplicity and speed of calculation. And in combination with simulation modeling, it is possible to assess the risk of the rate of return on investment, which is important for large projects that require high investment costs. The main drawback is the limited information on how cash flows and financial results will behave outside the time frame of the project. Therefore, the project should be assessed comprehensively, taking into account other financial ratios.
By investing cash, it is important to imagine how long the deposits will pay off. The amount of the initial investment and the development plan depend on this.
Dear Readers! The article talks about typical solutions legal issuesbut each case is different. If you want to know how to solve your problem - contact a consultant:
APPLICATIONS AND CALLS ARE ACCEPTED 24/7 and WITHOUT DAYS.
It is fast and IS FREE!
This is the amount of investments, the amount of additional investments, the time period, and so on. How to calculate in 2019 how long the project will pay off?
Important points
When investing in a business or any project, you need to imagine the purpose of this investment. Any investment involves making a profit.
However, the amount of income and the timing of its receipt can vary significantly. Therefore, it is required to determine the expediency of the contribution.
The need to assess the feasibility of investment may be due to various reasons. Economic efficiency analysis is carried out if:
- full or partial use is assumed as an investment;
- the project is assessed as one of the elements of ownership;
- an investment appraisal is required to make a decision.
The analysis is reduced to calculating the payback period of the project. This is one of the main indicators for any business project when determining the rationality of investing funds.
What it is
The payback period of the project is the period calculated from the start of the project implementation and the first investments until the moment when the volume of investments and the received profit are equal.
That is, the calculation of the payback period involves determining the period of reaching the break-even point.
It should be understood that any business is recognized as unprofitable until a certain time. Only after all the invested funds are returned, the receipt begins.
Depending on the chosen direction, the time period required to return the investment can vary significantly.
Too long term can become a reason for refusal to invest. Conversely, the speed of payback allows you to increase the amount of investment.
Among other things, establishing a payback period helps to evaluate an already operating business. For example, a project has crossed the break-even timeline, but the investment has yet to pay off.
In this case, the business remains unprofitable and it is probably necessary to revise the development plan or some parameters of the activity.
Why is it needed
The payback period of the project is the easiest and fastest assessment method investment attractiveness project. The calculation allows the investor to compare the risks of alternative projects.
For example, there are two projects with identical basic parameters, but with different payback periods based on the results of preliminary analysis.
The option in which the invested funds return earlier is considered less risky. As necessary, you can adjust the payback period by changing the risks.
As a rule, high-risk ones have the shortest payback period.
But basically, the adjustment of the payback period depends on the subjective opinion of investors regarding the degree of riskiness of investments.
The importance of determining the payback period also lies in the fact that the exact knowledge of the time to reach the break-even point allows you to determine how "long" money can be invested.
Most often, there is not enough own money for investments, and in most projects there are borrowed funds... And this is where the payback period becomes essential.
If the duration of lending ("the length of the money") is less than the period of making a profit, then questions arise about the repayment methods.
Another area of \u200b\u200bapplication of the payback indicator is to assess the compliance of a project with the expectations of owners and potential investors.
So most investors expect a quick return of funds, but in this case it is usually a small profit.
When a large income from a project is planned, the payback period for the most part will be long. Accordingly, investors investing large sums, want to know when they will be able to return the increased capital.
Different factors influence the payback period. This is the amount of investments, and cash flow, and current expenses, etc.
Having identified the significant elements of influence, it is possible to determine the payback period of the project with various parameters and thereby find the optimal algorithm of actions.
Regulatory regulation
The statutory value of the project payback period is not established by law. The indicator is set based on the owners' considerations regarding the use of capital.
When a project is commercial and created to generate profits, the quality of use of the invested funds is determined by comparing the current payback with the indicators calculated for alternative investment directions.
The most in a simple way presents a comparison of the return on equity in a particular area and the return on investment in various investment instruments.
When the return on equity is lower, then it is considered unsatisfactory.
At the same time, capital investments mean the main investment proceeds in the project, due to which the fixed assets are formed.
Such formation can be carried out through procurement, construction, refurbishment, reconstruction, etc. ().
According to Article 4 of the same Federal Law No. 39, the subjects of investment can be investors, project customers, users of fixed assets formed within the framework of investment. Every investor may be interested in a quick return on investment.
How to calculate the payback period of a project
The unit of measurement for the investment payback period of a project is most often a year. Although the indicator can be displayed in days, weeks and other time periods.
The calculation of the indicator determines how long the invested capital will pay off. That is, for a certain period, the amount of net profit will equal the amount of invested funds.
The payback indicator is calculated as the ratio of the average annual amount of equity to the amount of net profit for the year.
The calculation results are interpreted so that the lower the resulting value, the faster the investment will pay off.
Accordingly, the project with the shortest payback period is more attractive. But it is not enough to take into account only the basic parameters when calculating.
During the implementation of the project, assets are formed, which can, if necessary, be sold in order to receive cash. If such assets are available, then the investment pays off in a shorter period.
But the residual value of assets can decrease due to depreciation or multiply due to the creation of new assets. This circumstance also requires consideration.
Which formula is applied
The general formula for calculating the payback period takes into account:
To establish the payback period, the first indicator is divided by the second. That is, the formula looks like this:
To use this formula, you need to determine the amount of net profit. Its calculation is carried out according to the following algorithm:
When determining the net profit, the product means the result of the activity. It can be a product, and so on.
In some cases, it may be necessary to find a payback period for additional investments.
Moreover, additional investments can be expected and their implementation will depend on the rate of return.
The payback period for additional investments is calculated using a similar formula. The difference between additional and capital investments and the difference in net profit for additional and capital investments are used as calculation indicators.
How to calculate in Excel
You can calculate the payback period of the project in Excel. For the calculation, a table is created in which the input values \u200b\u200bare indicated.  Next, a cell in the "Cumulative total cash flow" column is made active. This can be done by clicking on the desired cell.
Thus, the location of the total value of the income from investments after the expiration of the first month is determined. After selecting a cell, you need to click the "Function" button.  In the window that appears, select the "SUM" function and then click "OK".
  In the next window, the first number will be displayed automatically. In this column, this is the first numeric cell (cell D4 with a value of 0).
The second number is entered manually (cell C5). This is the value of the investment return after the first month. Then "OK" is pressed again.  Cell D5 will display the sum of the value total income and income for the past month. The total income is added to the income after the end of the first month. The entered function is reflected in the formula bar.
  Next, with the mouse, you need to "stretch" from the lower right corner of the cell, while holding the left button, along column D, starting from cell D5. At this point, the function will line up the values.
Calculation examples
As an example of calculation, we can consider a situation when the volume of investments in a project is equal to 1,500,000 rubles. According to the terms, annual income is expected in the amount of 300, 400, 500, 600 and 500 thousand rubles, respectively.
Since the amount of investments for the first three years is equal to 1,200,000 rubles (300 + 500 + 400), and for four years:
That is the payback period of the project of 1,500,000 rubles less than 4 years, but more than 3 years. The uncovered balance is deducted from the initial project investments of income for 3 years:
The fractional part of the income of the 4th year is:
It follows from this that the total duration of the return on investment is 3 years + 0.5 years \u003d 3.5 years.
This example shows how to determine a simple payback period for a project; the formula does not take into account additional nuances. But you can calculate the discounted period.
How is it discounted
The discounted payback period is understood as the length of the period from the initial investment date to the payback period, when discounting is taken into account.
This is the earliest point in time in the billing period after which the net present value remains positive afterwards.
Video: how to calculate the payback period (PP) for an investment project in Excel
The essence of the calculation methodology consists of discounting cash flows, created by the project... These flows are sequentially summed up until the initial investment amounts are covered.
Discounting is the determination of the present value of cash flows for future periods, taking into account the discount rate.
The discount rate is the risk-free allocation rate that takes into account the project risk adjustment.
Most often, the discount rate reflects the minimum rate of return that an investor needs to invest. The discounted payback period is calculated to obtain a more accurate forecast.
Economic meaning of the indicator
From the position economic sense the project payback indicator is the main parameter when choosing an investment object.
In addition, knowledge of the payback period is necessary as a guideline when making significant decisions in the process of business development.
Receiving large profits is associated, as a rule, with long-term volume investments. Neither the company itself, much less the investors, are interested in such an option, when investments do not give a return for a long time.
Within the company, determining the payback period takes on an important role in developing a plan for further business development and determining the most priority areas of activity.
Related Articles