Discount in Excel. Pure discounted income (NPV). Excel calculation algorithm. Internal rate of profitability Chishindoh ()
NPV (Abbreviation, in English - Net Present Value), in Russian this figure has several variations of the name, among them:
- the net present value (abbreviated CPS) is the most common name and abbreviation, even the formula in Excel is just as it is called;
- clean discounted income (abbreviated CDS) - the name is due to the fact that cash flows are discounted and only then summed up;
- clean current cost (abbreviated chtts) - the name is due to the fact that all incomes and losses from activities due to discounting, as it were, are given to the current value of money (after all, from the point of view of the economy, if we earn 1,000 rubles. and we will actually get less than if we got the same amount, but now).
NPV is the profit indicator that participants will receive investment project. Mathematically, this indicator is by discounting the values \u200b\u200bof a pure cash flow (regardless of that negative it or positive).
Clean discounted income can be found for any period of the project time since its start (for 5 years, for 7 years, for 10 years, and so on), depending on the needs of the calculation.
What is it needed for
NPV is one of the project performance indicators, along with IRR, simple and discounted payback period. It is needed to:
- to understand what income will bring the project if it will pay off in principle or is unprofitable when he can pay off and how much money will bring at a specific point in time;
- to compare investment projects (if there are a number of projects, but there is not enough money for everyone, then projects are taken with the greatest opportunity to earn, i.e. the greatest NPV).
Formula of calculation
To calculate the indicator, the following formula is used:
- CF - the amount of pure cash flow during the time period (month, quarter, year, etc.);
- t - the period of time for which a pure cash flow is taken;
- N - the number of periods for which the investment project is calculated;
- i - discount rate taken into account in this project.
Example of calculation
To consider the example of calculating the NPV indicator, take a simplified project for the construction of a small office building. According to the investment project, the following cash flows are planned (thousand rubles):
| Article | 1 year | 2 year old | 3 year | 4 year | 5 year |
| Investing in the project | 100 000 | ||||
| Operating income | 35 000 | 37 000 | 38 000 | 40 000 | |
| Operating expenses | 4 000 | 4 500 | 5 000 | 5 500 | |
| Net cash flow | - 100 000 | 31 000 | 32 500 | 33 000 | 34 500 |
The project discount rate is 10%.
Substituting in the formula of the values \u200b\u200bof a pure cash flow for each period (where there is a negative cash flow, we put with a minus sign) and adjusting them, taking into account the discount rate, we obtain the following result:
NPV \u003d - 100 000 / 1.1 + 31 000 / 1.1 2 + 32 500 / 1.1 3 + 33 000 / 1.1 4 + 34 500 / 1.1 5 \u003d 3 089.70
To illustrate how the NPV is calculated in Excel, consider the previous example of it in the table. Calculation can be made in two ways.
- Excel has an emergency formula that calculates the net present value, for this you need to specify the discount rate (without a mark percentage) and highlight the range of pure money flow. Type of formula Such: \u003d ChPS (percentage; Range of pure money flow).
- It is possible to make an additional table yourself, where to approximate the cash flow and sum up.
In the figure, we led both calculations (the first shows the formulas, the second results of the calculations):


As you can see, both methods of calculation lead to the same result, which indicates that, depending on how it is more convenient for you to use, you can use any of the calculated options.
We will reveal such a concept as a pure discounted income (NPV) of the investment project, we will give the definition and economic meaning, on the real example Consider the calculation of NPV in Excel, as well as consider the modification of this indicator (MNPV).
Clean discounted income(NPV,Net.PRESENT.Value, net current cost, net discounted cost) - shows the effectiveness of investment in the investment project: the amount of cash flow during its implementation period and the current value (discount).
Clean discounted income. Formula of calculation
where: NPV is a net discounted income of the investment project;
CF T. (Cash Flow.) - cash flow during time t;
IC. (Invest. Capital.) – investment Capitalis an investor costs in the initial time period;
r is a discount rate (barrier rate).
Taking investment solutions based on the NPV criterion
The NPV indicator is one of the most common evaluation criteria for investment projects. Consider in the table which solutions can be accepted with different NPV values.
Calculation and forecasting of the future cash flow (CF) in Excel
The cash flow represents the amount of funds to which the company has / enterprise at the moment. Cash flow reflects financial sustainability Companies. To calculate the cash flow, it is necessary from the inflow of cash (CI,Cash Inflow) means to take out outflow (CO,Cash Outflows.) The calculation formula will look like this:
![]()
The definition of the future cash flow of the investment project is very important, so we consider one of the prediction methods using the MS Excel program. Statistical forecasting cash streams Perhaps only if the investment project already exists and functions. I.e cash Required to increase its power or its scaling. I would like to note that if the project is venture and does not have statistical data on production, sales, costs, then to assess the future monetary income Use an expert approach. Experts relate this project with analogues in this field (industry) and evaluate the potential of possible development and possible cash receipts.
When predicting the volumes of future revenues, it is necessary to determine the nature of the dependence between the influence of various factors (forming money receipts) and the cash flow itself. We will analyze a simple example of predicting future monetary revenues on the project, depending on the cost of advertising. If direct relationship is observed between these indicators, then you can predict what cash revenues will be depending on costs, using linear regression in Excel and the "Trend" functions. To do this, we write down the following formula for the cost of advertising in 50 rubles.
Cash flow (CF). B12 \u003d Trend (B4: B11; C4: C11; C12)

The size of the future cash flow will be 4831 rubles. With costs for advertising in 50 rubles. In reality, a much larger number of factors affect the determination of the size of future revenues, which should be selected according to the degree of influence and their relationships with each other with the help of correlation analysis.
Determine Discount Rate (R) for Investment Project
The calculation of the discount rate is an important task in calculating the current value of the investment project. The discount rate is an alternative profitability that an investor could receive. One of the most common objectives of determining the discount rate is an assessment of the company's value.
To estimate the discount rate, such methods are used as: model CAPM, WACC, Gordon model, Olson model, model of market multipliers E / P, profitability of capital, model Fami and Franch, Ross model (ART), expert assessment, etc. There are many methods and their modifications to estimate the discount rate. Consider the advantages and source data on the table that are used to calculate.
| Methods | Benefits | Source data for calculation |
| Capm model | Accounting for the effect of market risk at the discount rate | |
| Wacc. model | The ability to take into account the effectiveness of the use of both your own and borrowed capital | Quotes ordinary shares (MICEX Exchange), interest rates on borrowed capital |
| Model Gordon | Accounting for dividend returns | Quotes of ordinary shares, dividend payments (MICEX Exchange) |
| Model Ross. | Accounting for industry, macro and micro factors determining the discount rate | Statistics on macroindicators (Rosstat) |
| Model Fami and Franch | Accounting for the influence of the discount risk discount risks, the size of the company and its sectoral specifics | Quotes of ordinary shares (MICEX Exchange) |
| Based on market multipliers | Accounting for all market risks | Quotes of ordinary shares (MICEX Exchange) |
| Based on capital profitability | Accounting for the efficiency of using equity | Balance sheet |
| Based on expert evaluation | Ability to evaluate venture projects and various difficult factors | Expert ratings, rating and balloons |
The change in the discount rate is non-linear affects the change in the amount of pure discounted income, this dependency is shown in the figure below. Therefore, it is necessary when choosing an investment project not only to compare NPV values, but also the nature of the NPV change at different rates. Analysis of various scenarios allows you to choose a less risky project.

Calculation of net discounted income (NPV) using Excel
Calculate the net discounted income using the Excel program. Figure below presents a table of changes in future cash flows and their discounting. So, we need to determine the discount rate for a venture capital investment project. Since he has no issues of ordinary shares, there are no dividend payments, there are no profitability of its own and borrowed capital, we will use the method of expert assessments. The assessment formula will be as follows:
Discount rate= Risk-free rate + risk amendment;
Take a risk-free bid equal to interest on risk-free securities (GKO, OFZ data interest rates can be viewed on the website of the Central Bank of the Russian Federation, CBR.ru) equal to 5%. And the amendments to the sectoral risk, the risk of the effect of seasonality on sales and personnel risk. The table below shows the estimates of the amendments, taking into account the selected data of the risk species. These risks were highlighted by an expert way, so when choosing an expert, close attention should be paid.
| Types of risk | Risk Amendment |
| Risk of the effect of seasonality for sale | 5% |
| Sectoral risk | 7% |
| Personnel risk | 3% |
| 15% | |
| Rich-skilled interest rate | 5% |
| TOTAL: | 20% |
As a result, folding all the risk amendments affecting the investment project, the discount rate will be \u003d 5 + 15 \u003d 20%. After calculating the discount rate, you need to calculate cash flows and discount them.
Two options for calculating net discounted income NPV
The first option for calculating the net discounted income consists of the following steps:
- In the column "B", the reflection of the initial investment costs \u003d 100,000 rubles;
- The "C" column reflects all future planned cash receipts on the project;
- In the column "D", all future cash spending is recorded;
- CF stream (column "E"). E7 \u003d C7-D7;
- Calculation of discounted cash flow. F7 \u003d E7 / (1 + $ C $ 3) ^ A7
- Calculation of discounted income (NPV) minus initial investment costs (IC). F16 \u003d amounts (F7: F15) -b6
The second option for calculating the net discounted income is to use the financial function of the CPS built into Excel (net present value). Calculation of the net present value of the project per minus initial investment costs. F17 \u003d ChPS ($ C $ 3; E7; E8; E9; E10; E11; E12; E13; E14; E15) -b6
The figure below shows the calculations of the net discounted income. As we see the final result of the calculation coincides.

Modification of pure discounted income MnPV (Modified Net Present Value)
In addition to the classical formula for pure discounted income, financiers / investors sometimes use its modification in practice:

MnPV - Modification of pure discounted income;
CF T - cash flow during time t;
I T - cash outflow in time t;
r - discount rate (barrier rate);
d - reinvestment level, interest rate showing possible income from capital reinvestment;
n - the number of periods of analysis.
As we see, the main difference from the simple formula is the possibility of accounting for profitability of capital reinvestment. Evaluation of the investment project with the use of this criterion has the following form:
Advantages and disadvantages of the method of assessing net discounted income
We will compare between the advantages of the NPV and MnPV indicator. The advantages of using these indicators can be attributed:
- Clear selection and evaluation boundaries investment attractiveness project;
- The possibility of accounting in the formula (discount rate) of additional risks on the project;
- Use the discount rate to reflect changes the cost of money in time.
The disadvantages of pure discounted income include the following:
- The difficulty of evaluation for complex investment projects that include many risks;
- The complexity of accurate prediction of future cash flows;
- Lack of influence of intangible factors for future yield (intangible assets).
Summary
Despite a number of shortcomings, the indicator of pure discounted income is key in assessing the investment attractiveness of the project, comparing it with analogues and competitors. In addition to the NPV estimate for a clearer picture, it is necessary to calculate such investment coefficients as IRR and DPI.
Calculate the net present value and the internal rate of profitability through the formulasMS.Excel.
Let's start with definition, more precisely with definitions.
The net present value (NET Present Value, NPV) is called the amount of discounted payment flow values \u200b\u200bgiven to today (Taken from Wikipedia).
Or so: The net present value is the current cost of future cash flows of the investment project, calculated with the discounting, less investment (websitecFIN.rU)
Or so: Current The cost of a security or an investment project, determined by accounting for all current and future earnings and expenses at the corresponding interest rate. (Economy .
Dictionary . -
M. .
: "
INFRA -
M. ",
Publishing house "
The whole world ".
J. .
Black .)
Note1. The pure present value is also often called a net current value, a clean discounted income (CDD). But, because The corresponding MS Excel function is called ChPS (), then we will adhere to this terminology. In addition, the term net present value (emergency) explicitly indicates connection with.
For our purposes (calculation in MS Excel) I will define NPV like this:
The net present value is the amount of cash flows presented in the form of payments of arbitrary values \u200b\u200bcarried out at equal intervals.
Council: When you first get acquainted with the concept of a clean present value it makes sense to get acquainted with the materials of the article.
This is a more formalized definition without references to projects, investments and securitiesbecause This method can be used to assess cash flows of any nature (although, indeed, the NPV method is often used to assess the effectiveness of projects, including for comparing projects with various cash flows).
Also in definition there is no concept of discounting, because The discounting procedure is essentially calculating the present value by the method.
As it was said, in MS Excel to calculate the pure present value, the FFS () (English version - NPV ()) function is used. The formula is used;
CFN is a cash flow ( money amount) In the period n. Just the number of periods - N. To show whether the cash flow is income or expenses (investment), it is recorded with a certain sign (+ for income, minus - for expenses). The value of the cash flow in certain periods can be \u003d 0, which is equivalent to the absence of cash flow at a certain period (see Note2 below). I is a discount rate for the period (if an annual interest rate is specified (let 10%), and the period is the month, then I \u003d 10% / 12).
Note2.. Because The cash flow may not be present in each period, then the definition of NPV can be clarified: The net present value is the present value of cash flows presented in the form of payments of arbitrary values \u200b\u200bcarried out through time intervals, multiple period (month, quarter or year). For example, the initial investments were made in the 1st and 2nd quarter (indicated with the minus sign), in the 3rd, 4th and 7th quarter of cash flows were not, and in the 5-6 and 9th quarter Received the project (indicated with a plus sign). For this case, NPV is considered exactly as for regular payments (amounts in the 3rd, 4th and 7th quarter, you need to specify \u003d 0).
If the sum of the reduced cash flows of income (those with a sign +) are larger than the sum of the current cash flows of investments (expenses, with a minus sign), then NPV\u003e 0 (project / investment pays off). Otherwise NPV<0 и проект убыточен.
Choice of the discount period for the FFS function ()
When choosing a discount period, you need to ask yourself a question: "If we predict 5 years ahead, can we predict cash flows up to a month / to a quarter / up to the year?".
In practice, as a rule, the first 1-2 years of receipts and payments can be predicted more accurately, let's say monthly, and in the following years, cash flows can be defined, say, once a quarter.
Note3.. Naturally, all projects are individual and no single rule for determining the period can exist. The project manager must determine the most likely dates of the arrival of the amounts on the basis of existing realities.
Deciding with the terms of cash flows, for the FPS function () you need to find the shortest period between cash flows. For example, if in the 1st year of receipt is scheduled monthly, and in the 2nd quarterly, then the period should be selected equal to 1 month. In the second year, the amount of cash flows in the first and second month of the quarters will be equal to 0 (see example file, NPV sheet).

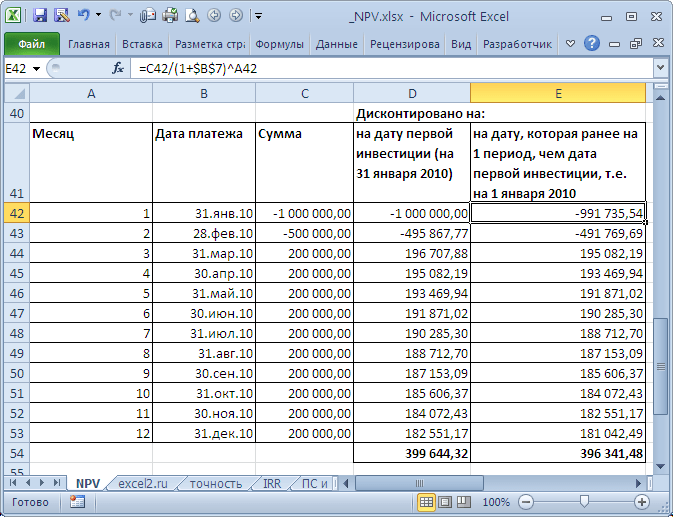
The NPV table is calculated in two ways: through the CPS () and formulas (calculation of the present value of each amount). From the table it is clear that the first amount (investment) is discounted (-1 000 000 turned into -991 735.54). Suppose that the first sum (-1 000 000) was listed on 01/31/2010, it means its present value (-991 735.54 \u003d -1 000 000 / (1 + 10% / 12)) is designed for 12/31/2009 (Without a special loss of accuracy, we can assume that on 01.01.2010)
This means that all amounts are not given at the date of transfer of the first amount, but for an earlier period - at the beginning of the first month (period). Thus, in the formula it is assumed that the first and all subsequent amounts are paid at the end of the period.
If it is required that all amounts are given on the first investment date, it does not need to be included in the CPS function arguments (), and you just need to add to the resulting result (see the example file).
Comparison of 2 discount options is given in the example file, the NPV sheet:
On the accuracy of calculating the discount rate
There are dozens of approaches to determine the discount rate. Many indicators are used for calculations: the weighted average cost of the company's capital; refinancing rate; Medium banking rate on the deposit; Annual percentage of inflation; income tax rate; country risk rate; Prize for the risks of the project and many others, as well as their combinations. It is not surprising that in some cases the calculations can be quite laborious. The choice of the desired approach depends on the specific task, we will not consider them. We only note one thing: the accuracy of the calculation of the discount rate must correspond to the accuracy of determining dates and sums of cash flows. Let's show an existing dependence (see example file, sheet accuracy).
Let there be a project: the term of implementation of 10 years, the discount rate is 12%, the period of cash flows is 1 year.

NPV amounted to 1 070 283.07 (discounted at the date of the first payment).
Because The term of the project is large, then everyone understands that the amounts in 4-10 are defined not exactly, but with some reasonable accuracy, say +/- 100 000.0. Thus, we have 3 scenarios: the basic (the average (most "probable") value is indicated), pessimistic (minus 100,000.0 from the base) and optimistic (plus 100 000.0 to the base). It should be understood that if the base amount is 700,000.0, then the amounts of 800,000.0 and 600,000.0 are no less accurate.
Let's see how NPV reacts when the discount rate is changed by +/- 2% (from 10% to 14%):
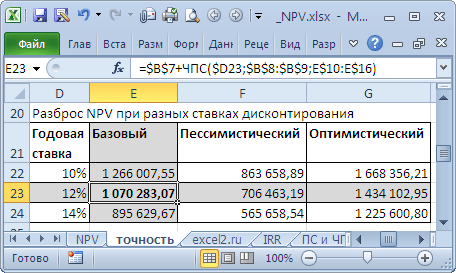
Consider an increase in the rate by 2%. It is clear that with an increase in the NPV discount rate decreases. If you compare NPV scatter ranges at 12% and 14%, it can be seen that they intersect by 71%.

Is there a lot or a little? The cash flow in 4-6 years is predicted with an accuracy of 14% (100,000/700,000), which is quite accurate. Changing the discount rate by 2% led to a decrease in NPV by 16% (when compared with the basic option). With the fact that the range of scattering NPV is significantly intersect due to the accuracy of determining the amounts of money income, an increase in 2% of the rate did not have a significant impact on the project NPV (taking into account the accuracy of determining the amounts of cash flows). Of course, this can not be a recommendation for all projects. These calculations are shown for example.
Thus, with the help of the above approach, the project manager must assess the costs of additional calculations of a more accurate discount rate, and decide how much they improve the estimate of NPV.
We have a completely different situation for the same project if the discount rate is known to us with less accuracy, say +/- 3%, and future streams are known with greater accuracy +/- 50 000.0

An increase in the discount rate by 3% led to a decrease in NPV by 24% (when compared with the base option). If you compare the variation ranges of NPV at 12% and 15%, it can be seen that they intersect only 23%.
Thus, the project manager, analyzing the sensitivity of the NPV to the value of the discount rate, should understand whether the NPV calculation will be specifically specified after calculating the discount rate using a more accurate method.
After determining the amounts and deadlines of cash flows, the project manager can estimate which maximum discount rate will be able to withstand the project (criterion NPV \u003d 0). The following section describes the internal rate of profitability - IRR.
Internal return rateIrr. (VD)
Internal rate of profitability (eng. iNTERNAL RATE OF RETURN, IRR (VDC)) is a discount rate in which the net present value (NPV) is 0. The term internal yield rate (GNI) is also used (see. example file, IRR sheet).
The advantage of IRR is that in addition to determining the level of profitability of the investment, it is possible to compare projects of different scale and different durations.

To calculate the IRR uses the FMC function () (English version - IRR ()). This feature is closely related to the CPS () function. For the same cash flows (B5: B14), the rate of profitability calculated by the FMR () function always leads to a zero net present value. The relationship of functions is reflected in the following formula:
\u003d ChPS (VDC (B5: B14); B5: B14)
Note4.. The IRR can be calculated without the function of VDC (): it is enough to have the FFS function (). To do this, use the tool (the "Install in the Cell" field should refer to the CPS formula (), in the "Value" field, set 0, the "Changing cell value" field must contain a link to the cell with the bet).
Calculation of NPV with constant cash flows using the PS function ()
Internal rate of profitability Chishindoh ()
By analogy with the ChPS (), which has a personal function of the EMD (), in numerous (), there is a function of chiiindh (), which calculates the annual discount rate at which it is numbered () returns 0.
Calculations in the function of ChishiFrom () are made by the formula:
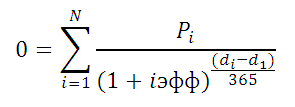
Where, pi \u003d i-i am the amount of cash flow; Di \u003d date of the i-th amount; D1 \u003d Date of the 1st amount (the initial date on which all amounts are discontinued).
Note5.. Function Chelichind () is used for.
We will analyze such an indicator as an internal rate of return of the investment project, we define the economic meaning and consider in detail an example of its calculation using Excel.
Internal rate of profitability of the investment project (IRR). Definition
Internal rate of return (eng. InternalRate.of.Return,IRR, internal profit rate, internal norm, internal rate of profitability, internal rate of discount, internal efficiency coefficient, indoor payback ratio) - The coefficient showing the maximum allowable risk on an investment project or the minimum acceptable level of profitability. The internal rate of profitability is equal to the discount rate, in which the net discounted income is absent, that is, is zero.
Internal rate of profitability of the calculation formula
CF T ( Cash Flow.) - cash flow during time t;
IC ( Invest. Capital.) - Investment costs for the project in the initial period (also are a cash flow CF 0 \u003d IC).
t - time period.
 |
★ |
Application of the internal rate of profitability
The indicator is used to assess the attractiveness of the investment project or for comparable analysis with other projects. For this, the IRR is compared with an effective discount rate, that is, with the desired level of project profitability (R). In practice, the weighted average cost of capital is often used ( WeightAverage.Cost Of.Capital, Wacc.).
| ValueIrr. | Comments |
| IRR\u003e WACC. | The investment project has an internal rate of profitability higher than the cost of its own and borrowed capital. This project should be adopted for further analysis. |
Irr. | The investment project has a rate of profitability lower than capital costs, this indicates the inappropriateness of investment in it. |
|
| IRR \u003d WACC. | The internal profitability of the project is equal to the cost of capital, the project is located at the minimum permissible level and should be adjusted to the cash flow and increase cash flows. |
| IRR 1\u003e IRR 2 | Investment project (1) has a greater potential for investing than (2) |
It should be noted that instead of the criterion of the WACC comparison, any other barrier level of investment costs can be calculated on the methods of assessing the discount rate. These methods are considered in detail in the article "". Simple practical example, may be comparison of IRR with a risk-free interest rate on bank deposit. So if the investment project has IRR \u003d 10%, and the percentage of the deposit \u003d 16%, then this project should be rejected.
The internal rate of profitability (IRR) is closely related to the net discounted income (NPV). The figure below shows the relationship between the size of the IRR and NPV, an increase in the yield rate leads to a decrease in income from the investment project.

Master class: "How to calculate the internal rate of profitability business plan"
Calculation of the internal rate of profitability (IRR) on the example in Excel
Consider an example of calculating the internal rate of profitability on the example using Excel, we analyze two methods of constructing using a function and using the "Search for solutions" add-in.
Example of calculating IRR in Excel using built-in function
The program has a built-in financial function, allowing you to quickly make the calculation of this indicator - ICC (the internal discount rate). It should be noted that this formula will only work when there is at least one positive and one negative cash flow. The calculation formula in Excel will have the following form:
Internal yield rate (E16) \u003d E6: E15)
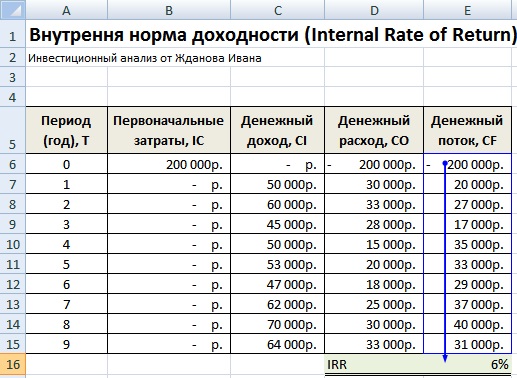
Internal rate of return. Calculation in Excel in the built-in formula
As a result, we obtained that the internal rate of profitability equals 6%, then to carry out investment analysis, the value obtained must be compared with the cost of the capital (WACC) of this project.
|
★ (Calculation of Sharpe Coefficients, Sortino, Trainer, Kalmar, Modillias Beta, VAR) + rate forecasting |
Example of calculating IRR through the add-on "Decision Search"
The second calculation option implies the use of the "Solution Search" add-on to find the optimal value of the discount rate for NPV \u003d 0. To do this, it is necessary to calculate the net discounted income (NPV).
The figure below shows the formula for calculating the discounted cash flow by year, the amount of which gives a net discounted income. The formula for calculating the discounted cash flow (DCF) is as follows:
Discounted cash flow (F) \u003d E7 / (1 + $ F $ 17) ^ A7
Clean discounted income (NPV) \u003d Amounts (F7: F15) -b6
Figure below shows the initial view for the calculation of IRR. It can be noted that the discount rate used to calculate the NPV refers to the cell in which there is no data (it is taken equal to 0).

Internal yield rate (IRR) and NPV. Calculation in Excel in the superstructure
Now our task is to find on the basis of optimization using the "Decision Search" add-in, then the value of the discount rate (IRR) in which the NPV project will be zero. To do this, open the "Data" section in the main menu and in it "Search for solutions".

When you press the window that appears, fill the strings "Set the target cell" is the formula for calculating NPV, then select the value of this cell equal to 0. The variable parameter will be a cell with the value of the internal rate of profitability (IRR). The figure below shows an example of calculating using the "Solution Search" add-in.

Search Irr values \u200b\u200bfor NPV \u003d 0
After optimization, the program will fill our empty cell (F17) with the value of the discount rate, in which the net discounted income is zero. In our case, it turned out 6%, the result completely coincides with the calculation of the formula structure in Excel.

The result of calculating the internal rate of profitability (IRR)
Calculation of the internal rate of profitability in Excel for non-systematic revenues
In practice, it often happens that the money does not receive periodic. As a result, the discount rate for each cash flow will change, it makes it impossible to use the Formula of VD to Excel. To solve this task, another financial formula is used (). This formula includes an array of dates and cash flows. The calculation formula will have the following form:
CHILDNOK (E6: E15; A6: A15; 0)

Calculation of the internal rate of profitability in Excel for non-systematic payments
Modified Internal Freight Norm (MIRR)
IN investment analysis Also used modified internal rate of profitability (Modified InternalRate.of.Return,Mirr) -this indicator reflects the minimum internal level of project profitability in the implementation of reinvestment in the project. This project uses interest rates derived from capital reinvestment. The formula for calculating the modified internal rate of profitability is as follows:
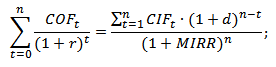
Mirr is the internal rate of return on the investment project;
Cof T - cash outflow during periods T;
CIFT - cash flow;
r is a discount rate that can be calculated as the weighted average capital value of WACC;
d is a percentage rate of capital reinvestment;
n - the number of time periods.
Calculation of the modified internal rate of profitability in Excel
To calculate this modification of the internal profitability rate, you can use the built-in Excel function, which uses in addition to cash flows, the size of the discount rate and the level of return on reinvestment. The calculation formula of the indicator is presented below:
MIRR \u003d MVSD (E8: E17; C4; C5)
Advantages and disadvantages of the internal rate of profitability (IRR)
Consider advantages of the indicator Internal rate of profitability to evaluate projects.
First, the possibility of comparing various investment projects among themselves according to the degree of attractiveness and efficiency of capital use. For example, a comparison with the yield on risk-minded assets.
Secondly, the possibility of comparing various investment projects with different investment horizon.
TO disadvantages of the indicator Believe:
First, the disadvantages in the assessment of the internal rate of profitability are to predict future cash payments. The size of the planned payments is influenced by many risk factors, the influence of which is difficult to objectively evaluate.
Secondly, the IRR indicator does not reflect the size of reinvesting into the project (this drawback is resolved in the modified internal rate of MIRR profitability).
Thirdly, it is not the ability to reflect the absolute amount of funds received from the investment.
Summary
In this article, we considered the formula for calculating the internal rate of profitability (IRR), two ways to build this investment indicator were disassembled in detail with Excel: based on embedded functions and add-on solutions for systematic and non-historical cash flows. Allocated that the internal rate of profitability is the second largest indicator of the assessment of investment projects after pure discounted income (NPV). The IRR variation is its MIRR modification, which also takes into account the profitability of capital reinvestment.
Net.PRESENT.Value (NPV / Chadd, clean discounted income) - one of the most common indicators of the effectiveness of the investment project. This is the difference between the time discounted by time from the project and the investment costs for it.
Advantages and disadvantages:
Positive qualities of ChDD:
- Clear decision making criteria.
- The indicator takes into account the cost of money in time (the discount rate is used in formulas).
Negative qualities of ChDD:
- The indicator does not take into account the risks. Although for more risky projects, the discount rate is higher, for less risky - below, of two projects with the same NPV are chosen less risky.
- Although all cash flows (the discount rate may include inflation, but often it is only a profit rate that is laid in the estimated project) are predictive values, the formula does not take into account the outcome of the event.
In order to evaluate the project, taking into account the probability of event of events come as follows:
Select key source parameters. Each parameter set a number of values \u200b\u200bindicating the probability of an event occurrence. For each set of parameters, the probability of occurrence and NPV is calculated. The following is the calculation of mathematical expectation. In the end, we get the most probabilistic NPV.
NPV definition method:
- Determine the current cost value (investment in the project)
- We make calculation of the current value of monetary proceeds from the project, for this income for each reporting period Current date
Where:
CF - cash flow;
R - Discount rate.
- Compare the current value of investments (our costs) in the project (IO) with the current cost of income (PV). The difference between them will be a pure discounted income - NPV.
NPV - shows the investor income or loss from investing in the project compared to the revenue from storing money in the bank. If NPV is more than 0, then the investment will bring more income than a similar contribution to the bank.
Formula 1 is modified if investment investments in the project are carried out in several stages (periods). ![]()
Where:
CF - cash flow;
R is the discount rate;
n - the number of periods.
INTERNAL RATE OF RETURN(Internal rate of return, Irr / Vind) - Determines the discount rate in which the investments are equal to 0 (NPV \u003d 0), or in other words, the cost of the project is equal to its income.
IRR \u003d R, at which NPV \u003d F (R) \u003d 0, we find from the formula:
Where:
CF - cash flow;
I - sum investment investments to the project in the T-Ohm period;
n - the number of periods.
This indicator shows the rate of profitability or possible costs when investing in the project (as a percentage).
Example
The corporation should decide whether to introduce new product line. The new product will have launch costs, operating costs, as well as incoming cash flows within six years. This project will have an immediate (t \u003d 0) outflow of money in the amount of $ 100,000 (which may include mechanisms, as well as staff training costs). Other cash outflows for 1-6 years are expected in the amount of $ 5,000 per year. The flow of funds is expected to be $ 30,000 per year 1-6. All cash flows after paying taxes, and for 6 years, no cash flow is planned. The discount rate is 10%. The reduced value (PV) can be calculated for each year:
| Year. | Cashflow. | Present Value |
|---|---|---|
| T \u003d 0. | -$100,000 | |
| T \u003d 1. | $22,727 | |
| T \u003d 2. | $20,661 | |
| T \u003d 3. | $18,783 | |
| T \u003d 4. | $17,075 | |
| T \u003d 5. | $15,523 | |
| T \u003d 6. | $14,112 |
The sum of all these values \u200b\u200bis a real net present value, which is equal to $ 8,881.52. Since NPV is more zero, it would be better to invest in a project than putting money to the bank, and corporations must invest in this project if there is no alternative to higher NPV.
The same example with Formulas in Excel:
- NPV (Bet, Net_inflow) + initial_investment
- PV (bet, year_number, yearly_net_inflow)
With more realistic problems it will be necessary to consider other factors such as tax calculation, uneven cash flow and value, as well as the availability of alternative investment opportunities.
In addition, if we use the formulas mentioned above, to calculate the NPV, we see that the incoming flows (tributaries) of funds are continuous and have the same amount; In the formula
![]()
can be used
![]() = 4.36.
= 4.36.
As mentioned above that the result of this formula, if multiplied by annual net cash, in-streams and reduce the initial costs of funds will be a net present value (NPV), so - 100,000 \u003d $ 8881.52 as NPV is greater than zero, it was It would be better to invest in a project than not to do anything, and corporations must invest in this project if there is no alternative to higher NPV.
An example of determinationNPV / ChDD inExcel 2010.
In MS Excel 2010, a function \u003d CPS () is used to calculate the NPV.
We find a net discounted income (NPV) of the project that requires investment investments by 90 thousand rubles, and the cash flow of which is distributed over time Figure 1., and the discount rate is 10%. 
Articles on the topic