Pairs trading on Forex indicators. Pair trading strategy - how to make money on the correlation of currency pairs? Example of using options
The ideal strategy is one that allows a trader to make money in any market, regardless of whether the price is currently falling or rising. Such trading systems are called arbitrage. There is true arbitration and statistical arbitration. And if the first is available to the vast minority, then every trader can figure out the second.
Pairs trading is a statistical arbitrage strategy, using which a trader opens transactions on two financial instruments simultaneously. Currency pairs are in a certain relationship with each other. How to determine it and what is needed for this - we will talk about this in the article.
What is pairs trading
Pairs trading is trading two currency pairs that correlate with each other and making money on the difference in rates when the prices of the instruments diverge. Which pairs can be called correlated?
Correlated currency pairs are financial instruments that move in the same direction. For example, if one pair is growing, the second one is also showing growth at this time. When one begins to fall, the price of the second also decreases. In practice, such ideal relationships do not exist. Sometimes couples begin to move asynchronously. It is the trader’s task to identify the moment of divergence in time and enter the market.
The idea of a pairs trading strategy is based on statistical data. It is based on the statement that if the prices of financial instruments moved according to certain laws in the past, they will face the same fate in the future. That is, if the rates of correlated pairs temporarily diverge, after a certain period the prices will move synchronously again.
An example of currency pair correlation is shown in the image below based on the platform Alpari broker. The charts of the euro-dollar and pound-dollar instruments move in the same way.

The type of correlation when pairs move in the same direction is called direct. There is another type of correlation with an inverse dependence of financial instruments on each other. In this case, when the value of one currency pair rises, the value of the other falls. This correlation is called inverse. An example of such a dependence is shown in the figure below. The chart of the dollar-franc pair is a mirror image of the chart of the euro-dollar pair.

Tools for finding correlated currency pairs
Determine which pairs correlate with each other in this moment, can be done in two ways - using correlation indicators or a special online service.
Correlation indicators display information in different ways. Some overlay two charts on one screen, others display an information board in which you can see which financial instruments are currently correlated with each other. It is more convenient to use the first type of indicators. This way, you will quickly see when the divergence between prices occurred, and you will be able to enter the market in time using the Pairs trading strategy.
There are also online services. They are easy to use. For analysis, you need to select a currency pair, specify the time period and the number of periods for calculation. The program itself will do the necessary calculations and give you a list of pairs with which the selected one correlates. financial instrument. An example of such a service is shown in the figure below.

We set the following condition: on the hourly chart of the euro-yen pair, find correlated pairs by analyzing the 50 nearest hours. The program calculated the correlation coefficient and displayed charts of currency pairs that best corresponded to the specified parameters. On the left side there is a table with calculation data. The closer the number is to one, the higher the correlation of a given instrument with the currency pair from the table.
Trading rules for pairs trading strategy
The trading strategy for pairs trading is simple and suitable even for beginners. To enter the market, you need to wait until a certain discrepancy appears between two price charts, then enter with sales of the instrument that is growing and buy the currency pair that is falling. This is clearly shown in the figure.

After a divergence appears on the chart, all that remains is to wait for the pairs to meet again at a certain point. At this point, both trades need to be closed.
The standard scenario for the development of the situation is this - one of the two pairs usually rises or falls in price more than the other moves in the opposite direction. On one transaction, a good profit is recorded, and on the other, minor losses. The positive difference is often very small, but the risks when trading according to the strategy are minimal. There are often situations where both trades are profitable, as in the example shown in the figure above.
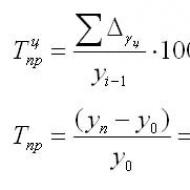
In order for a pairs trading strategy to remain profitable, it is important to correctly determine the size of the price divergence on the chart at which positions can be opened. This value is calculated as the average value for Last year.
To directly calculate the difference between the rates of correlating instruments, traders use the Trading View analytical platform. Divergence can be considered as the difference between the prices of currency pairs or a ratio. There are no fundamental differences between these approaches.
A typical mistake of traders trading using the pairs trading system is to ignore lot calculation. People often forget that the cost of a lot of one currency pair is different from the cost of a similar volume of another. In order to enter the market correctly and ultimately make a profit with the right actions, it is necessary that the point value for two instruments be the same. A lot calculator is suitable for these purposes. This value can also be calculated manually.
Pairs trading - trading strategy with minimal risks. However, it requires a careful approach and balanced analysis. Your profit depends on how correctly you choose the instruments for trading and how accurately you enter the market. You are unlikely to get mountains of gold, but you can get small, stable profits with minimal risks. Remember that trading profitability greatly depends on
It is no secret that any trader dreams of finding a break-even trading strategy or the opportunity to additionally hedge in order to avoid losses. If such a TS exists, then it can rightfully be called the trading Grail.
But can ordinary trader expect to find it on the vast expanses of the Internet? As surprising as it may sound, yes, it can. You just need to devote time to searching, then among many other vehicles you will definitely spot it - pairs trading strategy.
What is remarkable about it and how suitable it is for working with binary options, I will tell you in this article.
What is pairs trading?
Until recently, pairs trading was inaccessible to “mere mortals”; it was used by large market players who were accustomed to making profits regardless of how the market behaves. This strategy is based on the phenomenon of correlation of such trading instruments as stocks, indices and currency pairs.
In the first case, the price charts of trading instruments are almost identical to each other, which can be seen, for example, on the charts of EUR/USD and GBP/USD.
Inverse correlation means that the charts of the selected instruments mirror each other. This can be seen in the EUR/USD and USD/CHF pairs.

The essence of pairs trading is the simultaneous opening of two oppositely directed transactions on selected instruments. Since they are correlated, losses on one asset will be offset by profits from the second.
Thus, the trader always remains in the black. But for the strategy to work, you should choose assets with a high degree of correlation.
Choosing tools for pairs trading
Information on how trading instruments are related can be found on the website https://www.oanda.com. Here the data is presented visually, in the form of a table, in which red and blue circles of different saturation and size are indicated.
Blue color indicates that the pairs are related by inverse correlation, and red indicates direct correlation. Size and color saturation - the degree of relationship. For the pairs trading method, only those instruments are suitable whose correlation is 0.8 or higher over the past 12 months.
Most Popular Tools
You can select the appropriate tool based on the corresponding table. Among the assets that are most often used in working with this strategy: EUR/USD and GBP/USD, AUD/USD and NZD/USD, EUR/AUD and EUR/NZD, commodities and CFD contracts with a correlation degree above 0, 8.

Application of pairs trading
It should be noted that pair trading was born as a strategy for the currency and stock markets, but it can also be successfully used for the market binary options, and in in this case it may be even more effective.
First of all, you need to choose an algorithm that would allow you to open trades on time. Considering that trading instruments depend on similar fundamental factors, for example, news trading is suitable as such a trading vehicle.
Another trading strategy is to search for points of greatest divergence in the charts of the selected instruments. But to do this, you need to study their history for at least six months in order to identify the maximum number of points by which they deviated during this period.
Having made the appropriate conclusions, you should open multidirectional trades as soon as the charts demonstrate a significant divergence.

Advantages and disadvantages
Pairs trading, like any other trading system, has both advantages and disadvantages. The first includes work on a stable market pattern based on the correlation of assets. Another plus is that even a beginner can figure out the technique.
The difficulty lies in the need to correctly determine the moment of entry into the market and correctly calculate the number of points of potential profit (this is not relevant for the binary options market).
From this point of view, using this method for the BO market is the best solution. Why? It’s simple: a trader only needs to determine the direction of movement of the asset’s price, but does not need to determine how many points the price will move.

Considering that correlated assets always demonstrate the features described above, you can be almost sure of successful closing of transactions. In addition, BO traders have more trading opportunities than, for example, currency speculators, because the majority of binary options brokers allow you to trade a much larger number of instruments, which significantly increases the chances of high earnings.
Thus, it can be said that pairs trading- one of best systems earnings in the BO market. But to say this for sure, you need
Hello, dear guests of the blog site, today I decided to tell you about pairs trading, what it is, and what its advantages are. Surely you already know that in order to make money on the stock exchange, you need to try to reduce risks as much as possible. At the same time, it is also worth considering, otherwise even 2-3 unsuccessful trades can deprive you of all your profits.
Pairs trading is a special system of insurance against risks in the market. This system suitable for use on any financial market, so every trader should take a closer look at it.
Pairs trading originated many years ago, initially used by banks, large investors and hedge funds to protect themselves from risks. Some time later, thanks to the advent of the Internet, pairs trading became known to small speculators.
Features of pairs trading
Pairs trading involves trading two assets at once, on which orders are created in different directions. The main purpose of this system is to insure against risks. If orders on one asset bring losses, they will bring profit on the second.
At first glance, everything is quite simple, but in reality everything is far from so. The most difficult thing in pairs trading is choosing the right assets for which orders will be opened. For pairs trading, assets that correlate with each other should be selected. The correlation can be direct or mirror. Direct correlation is a repetition of price movement. In the next photo you can see an example of direct correlation.
Mirror is completely opposite price movements on two assets. You can find more detailed information about mirror pairs. You can see what mirror correlation looks like in the following picture.
 It is possible to determine the correlation between assets using special calculations, but this is unlikely to be advisable in our modern age of technology. Today, for these purposes, there are a lot of different tools that do everything necessary calculations on one's own. A striking example is the iCorrelationTable indicator, which you can download from the link below.
Download the iCorrelationTable indicator
For pairs trading, it is best to choose assets whose correlation is as close as possible to a value of +1 or -1. I would also like to note that the correlation is constantly changing, so before using certain assets for trading, you need to recalculate the coefficient.
 You can trade using this scheme on several assets at once. It is best to connect pairs from different groups For example, a good correlation is observed between oil and the dollar/ruble pair.
Indicator for pairs trading
After selecting the assets you plan to trade on, I recommend that you also install the OverLayChart indicator. Download this indicator You can . OverLayChart will display charts of two currency pairs in one window. The main task of the trader is to identify the maximum discrepancy between the charts and create two differently directed trades on two assets.
To use the OverLayChart indicator, you need to carry out its simple settings:
- In the SubSymbol line we indicate the second asset.
- If you are using mirrored currency pairs, then in the Mirroring line you need to specify the value True. If the assets you have selected have a direct correlation, then specify the value False.
After installing the indicator, two charts of the assets you have selected should appear on your chart at once, which will greatly facilitate your work.
Trading rules for pairs trading
The trading rules are quite simple. The trader needs to find the maximum discrepancy between assets and create orders. To identify the maximum discrepancy, you need to analyze the charts for the last year. You should find the average of the differences over the past year.
It is worth entering the market when the divergence reaches the average value obtained from the calculations. It is recommended to open a buy deal on one asset, and a sell deal on the other.
As for protective orders, there are no strict requirements. You can reduce risks if you place a pending deal in the other direction at a distance of 80-100 points from the opening of the order. Thus, even if prices go in the wrong direction, you will be able to limit losses, that is, the position will be locked.
If you decide to use pending orders, remember that if the price moves in the direction you want, they will need to be deleted. It is recommended to close orders at the moment of intersection of two charts of the assets you use.
As you may have noticed, pairs trading is a simple trading strategy, but one that produces amazing results.
You can use any time intervals for trading, but it is best to give preference to longer time frames, since they exhibit much less noise.
The trading platform is an essential tool for online trading. There are various trading platforms designed to conduct trading operations and carry out technical analysis in international financial markets in real time.But every trading platform must meet certain requirements that are reasonably demanded by traders and investors. The trading platform must be reliable, convenient, practical, mobile and, of course, of high quality.
The trader's trading terminal allows him to receive real-time data on the progress of trading on currency exchange in the form of charts and tables of financial instruments. The trading platform allows the trader to conduct graphical and technical analysis. A trader trading system , which he tests in his terminal, allows you to use trading robot
and leads him to success. One is impossible without the other. It is the trading platform that allows the trader to give orders to the broker to open and close transactions, place and remove orders. Through trading terminal
An investor or trader chooses a trading platform taking into account his market preferences, ambitions and individual abilities, focusing on the specifics of his trading.
A trader's trading system is not a rubber stamp in most cases. Ask any successful trader. Each of them studied and worked a lot before writing their trading system. A trader’s trading system is sometimes developed over many years and tested against history, which is why there are programs for traders
. It is a trader’s high-quality trading system, created through trial and error, that allows a trader to remain successful for many years, while using a trading robot.
The stability that many investors and traders dream of is possible, and its name is a trading robot, the work of which is facilitated by the trader’s excellent trading system. It is for high-quality analytics of financial markets that programs for traders have been created, which give them the opportunity to analyze various time intervals. It is also possible to use a trading robot or mechanical trading system only after developing and testing the trading system. There are various programs for traders that are suitable for testing
trading strategies
. For example, Omega Trade Station, a simple program with an easy programming language, with the function of calculating indicators that will be used in technical analysis. A trading robot is a mechanical trading system. But why does a trader need them? What's the use of them? And what disadvantages does a trading robot have?
A trading robot is a program that automatically places and removes orders according to the logic built into it based on the trading system. Also, the trading robot can perform additional functions at the discretion of the author of the trading system. That is, control submitted orders, monitor transactions, analyze trading, while providing charts and reports.
It turns out that the trading robot carries out automatic trading, long awaited and desired by many traders. Now let's figure out what advantages a trading robot gives us?
A trader who uses a trading robot in his work has clear advantages over a colleague who trades in the financial market the old-fashioned way.
The next plus is accuracy. The trading robot does not make mistakes. It calculates all output and input data with mathematical precision to the nearest thousandth. When placing an order, a trading robot will never miss a comma. A person is not immune from such mistakes.
The trading robot is not subject to psychological mood swings and emotions. The trading robot does not get tired, even if it works day and night. The trading robot produces beautiful charts and reports at any time you need.
You see, a trading robot gives a trader huge advantages, but there are also disadvantages.
This is the topic of another article.
Analysis and forecast as tools for playing on the stock exchanges. Doing stock market forecast , traders face a feeling of tension when choosing the moment of active action. In this state, the intuitive approach “works.” But scientific analysis stock market
involves knowledge of two methods that help the trader’s intuition: fundamental and technical analysis of the stock market. Fundamental stock market analysis is a method in which a forecast for the stock market is made based on detailed knowledge of indicators by viewing reports on financial condition issuing companies for a certain previous period of time. We study how effectively the company is managed, what place it occupies among competitors, what reviews are published about it and other indicators, which increases the chance of making a successful stock market forecast
issuer.
A successful market forecast is more likely when taking into account the political and socio-economic aspects, as well as when studying predictions of possible natural disasters. In this case, the stock market forecast can calculate stock price fluctuations with greater accuracy. A correct analysis of the stock market involves taking into account the influence of psychological nuances. What is meant? This is the psychological state of a trader, in which the analysis of the stock market, as well as the forecast of the stock market, is based on the emotions inherent in him at a particular moment of the decision to buy or sell.
This begs the conclusion how subjective the concepts of stock market analysis, stock market analysis, stock market forecast or stock market forecast are when playing on the stock exchanges. This is confirmed by practice when prices change, making the most detailed analysis of the stock market a waste of time, forcing traders to once again analyze what exactly was wrong with another failed forecast for the stock market. It turns out market forecast akin to art, where a stock market forecast turns into improvisation, when a trader throws aside a proven analysis of the stock market and makes a spontaneous but correct decision.
Almost all traders sooner or later ask themselves the question: is it really possible to make money on Forex without risk? Of course not, but it is quite possible to minimize losses. A pair trading strategy was even developed specifically to solve this problem.
If you look at the textbooks on financial markets, you can find the following definition: the pairs trading strategy is a trend-neutral investment system, which is based on the correlation of two or more assets. At first glance, it may seem that this approach is aimed at large players who have a lot of capital at their disposal, but this is not so - today every trader can use similar techniques.
First of all, you should understand the term “trend neutrality”. Here we are talking about strategies whose profits are not tied to a certain direction of the price impulse, in other words, if the underlying asset rises in price, the trader makes money, if it falls in price, the speculator makes a profit again, i.e. No matter which direction the price goes, the portfolio shows profitability.
Considering the fact that the problem of identifying a trend is familiar to all traders without exception (this is the main stumbling block), the opportunity to generate income in any market (without reference to the direction) began to rapidly gain popularity. In addition, the Great Recession of 2008 played a role in the formation and development of this technique, since pairs trading is the best and most accessible protection against unforeseen market crashes.
Pair trading strategy and asset correlation
From the basic definition presented at the very beginning of the article, it follows that the correlation of assets is taken as the basis of the strategy. This phenomenon has been used by scientists for several centuries, although it was originally formulated by biologists at the end of the 19th century.
If we discard the complex mathematical and statistical interpretations of the mentioned pattern, the bottom line is that the term “correlation” will characterize the relationship between two or more quantities, in other words, if the values of indicators A and B change synchronously, it can be argued that they correlate.

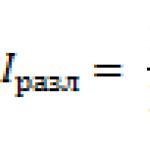
Of course, approximate estimates “by eye” are incorrect (such an approach contradicts the basic principles of scientific research), so statisticians developed special coefficients to characterize correlation dependencies.

The figure above shows one such formula - the Spearman rank correlation coefficient. As you can see, such calculations are elementary, but very cumbersome, so to simplify future calculations we will use a special indicator called iCorrelationTable.

Unlike many similar indicators, iCorrelationTable analyzes more than one pair of assets, but immediately builds a correlation matrix, the elements of which are specified by the trader himself through the “Symbol” file, located in the “MQL4\Files” directory. Such an insignificant add-on at first glance allows you to significantly reduce the time for optimizing your work portfolio.
The pairs trading strategy is applicable to all markets, so you can analyze not only Forex instruments, but also various CFDs, for example, shares of leading American corporations. We will return to these nuances a little later, when we move on to the practical side of the issue.
Selection of assets for manual trading
When it comes to the foreign exchange market, many analysts recommend working with the EURUSD and GBPUSD rates, as well as the EURUSD and USDCHF combination. At first glance, such a recommendation seems logical, since the correlation between the listed instruments is one of the strongest, but in practice, multidirectional trading of the mentioned pairs comes down to opening a position on cross rates.
To see this, consider simplest example. Suppose a trader saw a divergence in the dynamics of correlated currency pairs and therefore decided to simultaneously buy EURUSD and sell GBPUSD, hoping to make money on the “convergence” of quotes.
If the volume of these two transactions (in terms of US dollars) is the same, we will get nothing more than a synthetic bet on the growth of the EURGBP rate. Thus, in this case, the pairs trading strategy does not make any sense, since the speculator faces the following problems:
- The position remains at significant risk as the underlying cross is one of the most volatile;
- In the decision-making process there are extra links, since it is much easier to immediately buy/sell the EURGBP pair, which all DCs have.
A similar principle works in almost all Forex rates, so a simple conclusion suggests itself - in the portfolio, currency pairs should be combined with assets of other platforms. To make it clear what we are talking about, let’s consider a simple and understandable situation – the correlation of oil and the RUB exchange rate.

As you can see, the correlation coefficient between these instruments is close to -0.97 (a negative value only indicates that quotes move in different directions), so the pairs trading strategy will be based on the following assumptions:
- The dynamics of oil are primary - in the long term, the ruble exchange rate follows the trend in the energy market, i.e. when the cost of a barrel decreases, RUB will begin to become cheaper, and when the price of a barrel rises, the Russian currency will rise in price;
- From time to time, discrepancies will arise between the oil market and the USDRUB exchange rate due to macroeconomic factors and statements by officials from the Bank of Russia and the Federal Reserve.
Thus, if you choose the moment well, you can make money on such deviations, since the anomalous state cannot last for a long time simply by objective reasons. By the way, the factors mentioned in the second assumption usually include the following events:
- Tax period, when large Russian companies sell foreign currency earnings and transfer taxes to budgets;
- Payments on external corporate debt - in this case, the demand for foreign currency from the outside Russian companies increases, but after all the necessary calculations returns to normal;
- Decisions of the Central Bank of the Russian Federation and the Federal Reserve System on rates;
- Statements by the heads of the Central Bank of the Russian Federation and the Federal Reserve System, etc.
Of course, if the portfolio includes other assets and currency pairs, the list of factors will be completely different. In any case, such information is useful only for “general development”, since for a trader operating with numbers and quotes, only the situation on the chart is important.
Pairs trading strategy and stages of making deals
So, we already have one indicator (iCorrelationTable), which is used to determine long-term correlation. Such “matrix” estimates are calculated at the very beginning of the study, so it is inappropriate to repeat the information presented above. Let’s just call this stage “Portfolio Optimization”.
Unfortunately, the iCorrelationTable indicator does not save previously calculated values of correlation coefficients, so at the second stage you will have to evaluate the historical dynamics of the corresponding indicator. An algorithm called IND_Correlation does a good job of this task.

The chart above shows the layout of the mentioned indicator. As you can see, it consists of two lines - red and blue. The first shows directly the correlation coefficient, and the second displays the result of logarithmic transformations of the original value.
The pairs trading strategy even without logarithms is not the most elementary, so in this layout we will only be interested in the red curve. Regarding the IND_Correlation settings, here you should pay attention to several important functions:
Symbol1 is the code of the main asset;
Symbol2 – paired asset code;
Depth – period for calculating the correlation coefficient.
Considering that the fact of long-term correlation between the selected assets was already established at the first stage of research, this indicator will be useful for finding deviations from the norm. Thus, if the situation is analyzed on the H4 timeframe, the Depth field can be set to 50, although this value will depend on the “appetite” of each trader and investor, since it determines the frequency of signals.
We will be convinced of this a little later, but first we need to determine the parameters of anomalous deviations. Practice shows that for assets whose long-term correlation coefficient in absolute value is greater than 0.80, on lower timeframes there will be enough deviations in the area of 0 – 0.35, i.e. In order for the pairs trading strategy to generate a signal, we only need to establish the fact that the correlation dependence has weakened.

The chart above schematically shows entry points, after reaching which one could bet on the convergence of oil and the ruble. In this case, the value Depth = 50 was used for calculations. Now let’s return to the issue of signal frequency and try to reduce the calculation period to 25 bars.

The number of potential entry points has increased noticeably, but in this case you should prepare for the fact that after the signal appears, the divergence in asset dynamics may continue to grow, resulting in a floating loss on open position will increase significantly.
At the next stage, you need to open the transactions themselves, in particular, you will first have to determine which asset should be bought and which one should be sold. In the process of solving this problem, you can be guided either by a “clean schedule” or by using special software.
If a trader prefers to work with conventional charts, it is enough to simply compare the dynamics of two assets, since even with the naked eye one can see which asset caused the correlation to be broken. On the other hand, if a novice speculator is not confident in his abilities, he can always use auxiliary indicators.
The pairs trading strategy is greatly simplified if the OverLayChart indicator is added to the chart. It works very simply - the trader specifies the ticker of the trading instrument in the settings, the discrepancy with which must be assessed, after which the speculator will have the opportunity to visually compare the dynamics of different assets.

And at the last stage, it is enough to open positions in equal volume for price convergence. In the example presented, the ruble turned out to be undervalued against the dollar, since it was falling for some time, despite the rising price of oil (we remind you that in the figure above the dynamics of oil prices are presented in an “upside down” form, since in this case it is easier to compare trends). Thus, when the correlation between USDRUB and BRN weakened (the coefficient reached -0.35), a portfolio consisting of short positions in USDRUB and BRN should have been built.
It should be noted that some traders make a fatal mistake and start working with only one asset, for example, since the ruble is a slave, they simply buy Russian currency at such moments when the discorrelation reached its peak.
This is not recommended for one simple reason - the transaction becomes vulnerable to powerful non-recoil trends. The pairs trading strategy is free from this drawback due to the hedging operation, i.e. even if a strong trend begins in the market, the trader’s risk will be limited by the size of the asset divergence.
Which pairs trading advisor to use
Considering the fact that the system discussed today is very promising and involves minimal risks, many traders are interested in robots and advisors of the same name, so the issue of automation should be given special attention.
Indeed, over the past 10 years, many attempts have been made to automate discorrelation trading, but they all ended in fiasco. The fact is that the programming languages mql4 and mql5 are not the most best choice for developing advisors, since such ideas involve working with several assets at once.
Of course, creating a pairs trading advisor is technically possible, but practice shows that this task requires serious financial investments and labor costs, otherwise dozens of working experts could be found on the World Wide Web.
In the process of selecting materials for review, we tested some robots whose authors worked on implementing the idea of pair trading. Based on the results of the tests, it became obvious that almost all of them are inoperative, and even if they are launched, they make serious mistakes during the trading process. Here are the main problems:
- The pairs trading advisor does not open a position on a correlating asset;
- Errors occur when launching auxiliary indicators;
- There is no way to optimize parameters in the tester, since in MT4 this can only be done for one pair.
The list of errors could go on for a long time, but the conclusion is already obvious – it is almost impossible to find a high-quality algorithm for free. In our opinion, this is not critical, since pair trading is always focused on large time frames, which means that the time spent on managing transactions is not so significant that it is necessary to automate them.
However, if time optimization is a decisive factor, you can always resort to well-known developments, for example, contrary to popular belief, a regular “grid”, which is criticized by many traders for its built-in martingale, can provide significant help.

For grids to be useful, several important conditions must be met. First, search trading signal, as well as opening the first transactions, you still have to manually (we buy one asset, sell the second). This circumstance is due to the fact that the auxiliary advisor for pairs trading does not have a module with the help of which the entry point is automatically recognized.
Secondly, the robot’s code should not contain “magicians”, since otherwise it will refuse to accompany transactions opened manually and will begin to independently look for entry points that have nothing to do with correlation dependencies.
Thirdly, to trade by correlation, you need to use the stop version of the grid, which opens new transactions only with sell-stop and buy-stop orders. Unlike the “limit” method, in this case the chance of catching a trend on an undervalued/overvalued asset increases significantly.

And the last thing you should definitely pay attention to is that the multicoefficient, which is responsible for connecting the Ilana/Pyramiding module in the process of opening new legs of the grid, must be equal to one, since when it increases, the trader takes on additional risks that have nothing to do with the initial point entrance.
A pairs trading advisor, among other things, must work correctly on different assets, since strictly on foreign exchange market This tactic is used quite rarely. We already drew attention to this fact above, so we took as an example the combination of the USDRUB pair and Brent oil, i.e. analyzed two instruments from different sites.
Pros and cons of the considered system
As you can see, the pairs trading strategy has both advantages and disadvantages, so it is not suitable for all speculators. In particular, to strengths There are several similar algorithms important features, the competent operation of which will allow you to regularly take profits from the market:
- Signals are generated on large time frames, so it is not necessary to spend a lot of time managing orders. Thus, correlation trading can be combined with other systems (intraday) and the main profession;
- Due to the fact that assets whose correlation coefficient exceeds 0.80 are selected for work, the accuracy of the signals is quite high;
- By opening two differently directed positions, the risk for each of them is hedged, i.e. if a powerful impulse suddenly begins in the market (as usually happens before crises and recessions), the trader compensates for the loss on one order with profit from the second;
- Due to the fact that deviations are often formed under the influence of fundamental factors, the speculator has a real chance to master the basics economic analysis, i.e. learn to correctly interpret statements by officials from Central Banks, macroeconomic statistics, etc.
However, the considered system also has some disadvantages that are unacceptable for some traders. First of all, attention should be paid to the fact that it is not suitable for scalpers, although from time to time enthusiasts appear on trading forums trying to optimize it for intraday trading.
The fact is that the pairs trading strategy is vulnerable in flats, in particular, after a sideways trend, as new candles form, trading participants often lose interest in the idea of convergence/divergence of assets, i.e. the market moves to a new state, while long-term correlation dependencies, which are visible on the markings of the IND_Correlation indicator, remain in force.
Secondly, opening counter positions on different assets leads to increased costs for spreads and commissions. Of course, the specific fees will depend on the type of instrument (for example, they will be different for oil and the USDRUB pair), but if you roughly round up the estimates, the associated losses with such trading double.
And the last minus is related to problems in automation, since today in free access It is extremely difficult to find a decent and efficient advisor. Grid algorithms provide some help, but remember that they were originally created for other purposes.
Articles on the topic