How to calculate the tax burden. Tax burden coefficient by type of economic activity Tax burden coefficient by industry
The so-called Concept of the planning system for on-site tax audits was approved by order of the Federal Tax Service of Russia dated May 30, 2007 No. MM-3-06/333. It allows you to understand to what extent your business is at risk of being subject to an on-site audit by tax authorities. One of the main criteria is the tax burden by type economic activity. In mid-May 2018, the Russian Tax Service published updated indicators of the tax burden by type of economic activity for 2017. We provide a complete list of them in this review (can be downloaded) so that each company (IP) can compare them with its own value.
Composition of activities
Traditionally, indicators of the tax burden by type of economic activity are fixed in Appendix No. 3 to the mentioned order. Now - for 2017 (the Federal Tax Service updates them annually). The document deals with enlarged areas of activity according to the OKVED-2 classifier. Look for the one that best suits your field.
Types of indicators
Note that the coefficients of tax burden by type of economic activity in the Concept on-site inspections The Federal Tax Service is always presented in tabular form. And there are 2 types of them:
Please note that the values of the tax burden by type of economic activity for 2017 are shown as percentages.
The tax burden is the ratio of taxes (including personal income tax) and fees according to the official statistical reporting of the Federal Tax Service of Russia to the turnover of organizations according to Rosstat, multiplied by 100%.
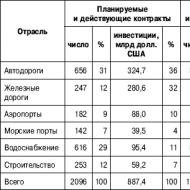
| Type of economic activity (according to OKVED-2) | Period 2017 | |
| TOTAL | 10,8 | 3,6 |
| Agriculture, forestry, hunting, fishing, fish farming - total | 4,3 | 5,5 |
| crop and livestock farming, hunting and provision of related services in these areas | 3,5 | 5,4 |
| forestry and logging | 7,5 | 6,8 |
| fishing, fish farming | 7,9 | 5,5 |
| Mining - total | 36,7 | 1,8 |
| extraction of fuel and energy minerals - total | 45,4 | 1,0 |
| extraction of mineral resources, except fuel and energy | 18,8 | 4,1 |
| Manufacturing industries – total | 8,2 | 2,2 |
| production of food, beverages, tobacco products | 28,2 | 2,4 |
| production of textiles, clothing | 8,1 | 4,2 |
| production of leather and leather products | 7,9 | 4,7 |
| wood processing and production of wood and cork products, except furniture, production of straw products and wicker materials | 2,0 | 3,6 |
| production of paper and paper products | 4,4 | 1,8 |
| printing and copying activities | 9,2 | 4,3 |
| production of coke and petroleum products | 5,1 | 0,2 |
| production of chemicals and chemical products | 1,9 | 2,4 |
| production medicines and materials used for medical purposes | 6,9 | 3,0 |
| production of rubber and plastic products | 6,3 | 2,6 |
| production of other non-metallic mineral products | 8,9 | 3,5 |
| metallurgical production and production of finished metal products, except machinery and equipment | 4,4 | 2,4 |
| production of machinery and equipment, not included in other groups | 8,8 | 3,9 |
| production of electrical equipment, production of computers, electronic and optical products | 9,9 | 4,3 |
| production of computers, electronic and optical products | 12,5 | 5,3 |
| production of electrical equipment | 6,7 | 3,0 |
| production of other Vehicle and equipment | 4,7 | 4,8 |
| production of motor vehicles, trailers and semi-trailers | 5,1 | 1,7 |
| Providing electricity, gas and steam; air conditioning – total | 6,8 | 2,4 |
| generation, transmission and distribution of electricity | 8,1 | 2,2 |
| production and distribution of gaseous fuels | 1,3 | 1,4 |
| production, transmission and distribution of steam and hot water; air conditioning | 6,5 | 4,5 |
| Water supply, sanitation, organization of waste collection and disposal, activities and elimination of pollution - total | 8,4 | 4,8 |
| Construction | 10,2 | 4,3 |
| Wholesale and retail trade; repair of vehicles and motorcycles – total | 3,2 | 1,2 |
| wholesale and retail trade motor vehicles and motorcycles and their repair | 2,7 | 1,1 |
| wholesale trade, except wholesale trade vehicles and motorcycles | 3,1 | 0,9 |
| retail trade, except trade in motor vehicles and motorcycles | 3,6 | 2,2 |
| Activities of hotels and enterprises Catering- Total | 9,5 | 5,7 |
| Transportation and storage – total | 6,8 | 4,8 |
| activity railway transport: intercity and international passenger and freight transportation | 8,5 | 6,8 |
| pipeline transport activities | 4,5 | 2,1 |
| water transport activities | 9,3 | 4,1 |
| air and space transport activities | neg. | 3,0 |
| postal and courier activities | 14,4 | 11,6 |
| Activities in the field of information and communication - total | 16,4 | 5,2 |
| Operations activities with real estate | 21,3 | 6,3 |
| Administrative activities and related additional services | 15,4 | 9,2 |
According to the Federal Tax Service, the average safe share of deductions in Russia for the 3rd quarter of 2017 is 87.9%. The figure increased compared to the 2nd quarter: then it was 87.8%. However, compared to the beginning of the year, the figure has decreased. In the 1st quarter, the Russian average share of safe deductions was 88.5%.
Inspectors do not use the average data for Russia in practice. We need to focus on regional indicators. It is they who will be guided by the office when processing your declaration for the 3rd quarter of 2017.
We present the safe share of deductions by region of Russia. The calculation was carried out on the basis of form 1-VAT from the website of the Federal Tax Service.
If the company’s data is higher than the data for the region, tax authorities will be interested in the organization. Demands for clarification, commissions, and even the appointment of on-site inspections are possible. Previously, tax officials openly stated this in a letter from the Federal Tax Service of Russia dated July 17, 2013 No. AS-4-2/12722. But it was canceled (letter of the Ministry of Finance of Russia dated March 21, 2017 No. ED-4-15/5183). But experts say that there will no longer be tax commissions in the form we are familiar with, only legalization commissions will remain tax base for payment wages and insurance premiums. Their tasks and methods of work are fixed.
Sample explanations about the share of VAT deductions.
Safe share of VAT deductions in Russian regions (in%, for the 3rd quarter of 2017)
Region | Share of deductions, % | Region | Share of deductions, % |
|---|---|---|---|
Altai region | Primorsky Krai | ||
Amur region | Pskov region | ||
Arhangelsk region | Republic of Adygea | ||
Astrakhan region | Altai Republic | ||
Belgorod region | Republic of Bashkortostan | ||
Bryansk region | The Republic of Buryatia | ||
Vladimir region | The Republic of Dagestan | ||
Volgograd region | The Republic of Ingushetia | ||
Vologda Region | Republic of Kalmykia | ||
Voronezh region | Republic of Karelia | ||
Moscow city | Komi Republic | ||
City of Saint Petersburg | Republic of Crimea | ||
City of Sevastopol | Mari El Republic | ||
Jewish Autonomous Region | The Republic of Mordovia | ||
Transbaikal region | Republic of North Ossetia-Alania | ||
Ivanovo region | Republic of Tatarstan | ||
Irkutsk region | Tyva Republic | ||
Kabardino-Balkarian Republic | The Republic of Khakassia | ||
Kaliningrad region | The Republic of Sakha (Yakutia) | ||
Kaluga region | Rostov region | ||
Kamchatka Krai | Ryazan Oblast | ||
Karachay-Cherkess Republic | Samara Region | ||
Kemerovo region | Saratov region | ||
Kirov region | Sakhalin region | ||
Kostroma region | Sverdlovsk region | ||
Krasnodar region | Smolensk region | ||
Krasnoyarsk region | Stavropol region | ||
Kurgan region | Tambov Region | ||
Kursk region | Tver region | ||
Leningrad region | Tomsk region | ||
Lipetsk region | Tula region | ||
Magadan Region | Tyumen region | ||
Moscow region | Udmurt republic | ||
Murmansk region | Ulyanovsk region | ||
Nenets autonomous region | Khabarovsk region | ||
Nizhny Novgorod Region | Khanty-Mansiysk Autonomous Okrug - Ugra | ||
Novgorod region | Chelyabinsk region | ||
Novosibirsk region | Chechen Republic | ||
Omsk region | Chuvash Republic | ||
Orenburg region | Chukotka Autonomous Okrug | ||
Oryol Region | Yamalo-Nenets Autonomous Okrug | ||
Penza region | Yaroslavl region | ||
Perm region |
Tax burden by type of economic activity in 2017— data on the tax burden published by the Federal Tax Service of Russia, on the basis of which the tax service determines who will be audited. Tax burden data is published annually in Appendix 3 to.
Here are the data for 2016, which was published in May 2017.
Data on the tax burden for 2017 (published in May 2018) at the link:
A comment
The tax burden by type of economic activity is calculated annually by the Federal tax service Russian Federation(Federal Tax Service of the Russian Federation) and is published in Appendix 3 to.
The tax burden is used by the Federal Tax Service of the Russian Federation as one of the criteria for assigning a visiting tax audit. Thus, if the actual tax burden of a taxpayer is significantly lower than the industry average, then the tax authority considers this as a suspicious sign and may conduct a tax audit (see).
Analysis of the tax burden includes a comparison of the tax indicators of the organization (taxpayer) with the indicators of other companies in the industry or the relevant market.
In 2017, the tax burden for 2016 is known. The fact is that the tax burden is calculated after processing tax returns and financial statements per calendar year. Tax returns and the Federal Tax Service receives financial statements for the calendar year by the end of March of the next year. Then the Federal Tax Service of the Russian Federation processes this data and by the beginning of May of the next year publishes the Tax burden by type of economic activity for the calendar year (for example, in May 2017 the tax burden for 2016 is published).
Tax burden by type of economic activity for 2016*
| Type of economic activity | year 2014** | 2015** | 2016** |
| TOTAL | 9,8 | 9,7 | 9,6 |
| Agriculture, hunting and forestry | 3,4 | 3,5 | 3,5 |
| Fishing, fish farming | 6,2 | 6,5 | 7,7 |
| Mining including: |
38,5 | 37,9 | 32,3 |
| extraction of fuel and energy minerals | 42,6 | 41,5 | 35,6 |
| extraction of mineral resources, except fuel and energy | 8,3 | 11,3 | 11,9 |
| Manufacturing industries including: |
7,1 | 7,1 | 7,9 |
| production of food products, including beverages, and tobacco | 19,4 | 18,2 | 19,7 |
| textile and clothing production | 8,1 | 7,8 | 7,7 |
| production of leather, leather goods and footwear production | 6,3 | 6,2 | 7,3 |
| wood processing and manufacture of wood and cork products, except furniture | 3,9 | 2,8 | 2,2 |
| production of cellulose, wood pulp, paper, cardboard and products made from them | 2,8 | 3,5 | 4,3 |
| publishing and printing activities, replication of recorded media | 13,3 | 13,4 | 11,6 |
| production of coke and petroleum products | 3,4 | 2,6 | 4,7 |
| chemical production | 3,2 | 4,2 | 3,5 |
| production of rubber and plastic products | 5,6 | 5,6 | 6,0 |
| production of other non-metallic mineral products | 8,0 | 8,6 | 8,6 |
| metallurgical production and production of finished metal products | 3,8 | 4,5 | 4,3 |
| production of machinery and equipment | 11,7 | 12,9 | 13,7 |
| production of electrical equipment, electronic and optical equipment | 10,9 | 11,2 | 11,1 |
| production of vehicles and equipment | 6,0 | 6,0 | 5,2 |
| other production | 5,4 | 4,3 | 4,0 |
| Production and distribution of electricity, gas and water including: |
4,8 | 5,4 | 6,1 |
| production, transmission and distribution of electrical energy | 4,9 | 5,7 | 6,4 |
| production and distribution of gaseous fuels | 2,7 | 1,9 | 3,3 |
| production, transmission and distribution of steam and hot water (thermal energy) | 5,2 | 5,6 | 4,7 |
| Construction | 12,3 | 12,7 | 10,9 |
| Wholesale and retail; repair of vehicles, motorcycles, household products and personal items including: |
2,6 | 2,7 | 2,8 |
| trade in motor vehicles and motorcycles, their Maintenance and repairs | 2,2 | 2,8 | 2,4 |
| wholesale trade, including trade through agents, except trade in motor vehicles and motorcycles | 2,4 | 2,4 | 2,6 |
| retail trade, except trade in motor vehicles and motorcycles; repair of household products and personal items | 3,6 | 3,7 | 3,7 |
| Hotels and restaurants | 9,0 | 9,0 | 9,5 |
| Transport and communications including: |
7,8 | 7,3 | 7,2 |
| railway transport activities | 9,5 | 10,2 | 8,4 |
| transportation via pipelines | 3,5 | 1,7 | 3,2 |
| water transport activities | 11,1 | 13,6 | 13,1 |
| air transport activities | 2,9 | 1,4 | neg. |
| connection | 12,9 | 12,8 | 12,6 |
| Real estate transactions, rental and provision of services | 17,5 | 17,2 | 15,4 |
| Provision of other utility, social and personal services including: |
25,8 | 25,6 | 23,4 |
| activities for organizing recreation and entertainment, culture and sports | 29,1 | 29,1 | 25,6 |
* - Calculation was made taking into account income tax revenues individuals
** - Calculation for 2006, 2010-2016. made without taking into account revenues from the unified social tax and insurance contributions for compulsory pension insurance
When selecting organizations for an on-site tax audit, Federal Tax Service specialists evaluate their activities according to certain criteria. For each of them there is threshold value. If a company's score on this criterion goes beyond the threshold, then its chances of becoming a candidate for an on-site audit increase. In total there are more than 40 such criteria, but regarding VAT for tax authorities the main criterion is share of VAT deductions.
How to assess whether an organization pays enough value added tax? After all, absolute numbers in this regard are completely uninformative. The amount of tax depends on a combination of factors, including the type of activity, profitability, markup, seasonality and many others, including the general economic situation in the country. Therefore, the wording of the question “ How much VAT should I pay so that the tax authorities do not want to come with an audit? "is itself incorrect.
It is much more correct to ask the question about the share of deductions in total amount accrued VAT, because it is this indicator that tax authorities pay attention to. Officially, it is called the share of VAT deductions in the calculated amount of VAT on taxable items.
For Russian Federation threshold value of this indicator as of 01.11.2019 amounts to
Information on the safe percentage of deductions by region— these are the numbers the local tax office focuses on when checking.
For Moscow indicator threshold value as of 01.11.2019 amounts to
Calculation of the share of VAT deductions
What does this indicator mean and how is it calculated? This is nothing more than a percentage of VAT deductions in the amount of accrued tax. To calculate it, you need only two values, which can be found in section 3. This is line 190 (VAT deductible) and line 118 (VAT accrued).
The indicator is calculated using the following formula:
VAT deductible / VAT accrued * 100%
In order to see the dynamics of this indicator, it is better to take the relevant data from the last four declarations.
The result of the calculation will be a percentage value corresponding to the share of VAT deductions in the total amount of accrued tax. In other words, this value shows what percentage of the accrued VAT the company claims to deduct. He is the one who will be compared tax authorities with a threshold indicator in order to draw a conclusion about the degree of tax risks of the company for VAT. If the proportion of VAT deductions according to the taxpayer’s declaration is greater, then this immediately attracts the attention of tax inspectors.
An example of calculating the safe amount of VAT deduction
Suppose for reporting period a taxpayer from Moscow paid VAT in the amount 100 000 rubles
It is impossible to say whether this is a lot or a little for this organization. But the picture becomes clearer if we calculate the share of VAT deductions:
According to the company’s declaration, for the specified period the amount of calculated VAT, taking into account the restored amounts 1 500 000 rubles ().
Tax deduction for the same period amounted to 1 400 000 rubles ().
Substituting these figures into the above formula, we find that the share of VAT deductions in the amount of accrued tax in the period under review was
1 400 000 / 1 500 000 = 93,33% .
This is more than the threshold value 88,76% for Moscow (as of November 1, 2019), which means the tax office has a reason to take the taxpayer "on a pencil".
What should be the amount of VAT in the considered example for Moscow, so as not to attract increased attention from tax authorities?
Based on the criteria used by the Federal Tax Service, the company in our example needs to pay at least 168,600 rubles VAT, so as not to leave the “safe” zone.
What are the consequences of exceeding the threshold value?
Obviously, verification will not knock on your door as soon as the specified indicator leaves the “safe” zone. After all, as mentioned above, there are four dozen criteria for assessing tax risks. This is exactly why the fact that the share of VAT deductions is in the “safe” zone in no way guarantees the lack of interest of the Federal Tax Service in the taxpayer.
Thus, if the share of VAT deductions has gone beyond the threshold value, we can assume that the scales have tilted slightly towards an on-site tax audit of your company. However, you should not be afraid of this, because if the business is conducted honestly, then the entrepreneur, director or accountant always has something to object to the claims of the Federal Tax Service employees.
Safe VAT deduction by region
Information about safe share of VAT deduction for the fourth quarter of 2019 can be calculated according to the tax report 1-VAT.
We have already calculated all the data and summarized in one table:
| Safe share of deductions as of 11/01/2019 | Safe share of deductions as of 08/01/2019 | Safe share of deductions as of 05/01/2019 | Safe share of deductions as of 02/01/2019 | |
| RUSSIAN FEDERATION | 87,39% | 86,93% | 86,10% | 88,05% |
| including: | ||||
| Central Federal District | 89,26% | 88,76% | 88,48% | 89,51% |
| Belgorod region | 91,63% | 91,68% | 92,00% | 92,75% |
| Bryansk region | 90,11% | 88,89% | 86,69% | 92,97% |
| Vladimir region | 85,34% | 85,73% | 85,73% | 87,45% |
| Voronezh region | 92,93% | 92,91% | 93,53% | 92,41% |
| Ivanovo region | 92,56% | 92,23% | 92,36% | 94,08% |
| Kaluga region | 90,01% | 89,90% | 90,03% | 89,23% |
| Kostroma region | 86,08% | 85,73% | 87,83% | 89,76% |
| Kursk region | 89,94% | 91,35% | 91,74% | 91,91% |
| Lipetsk region | 104,42% | 105,42% | 106,71% | 109,05% |
| Moscow region | 89,04% | 88,74% | 88,99% | 89,85% |
| Oryol Region | 92,97% | 92,55% | 93,47% | 94,65% |
| Ryazan Oblast | 83,23% | 83,81% | 85,76% | 85,14% |
| Smolensk region | 95,32% | 94,64% | 94,07% | 95,27% |
| Tambov Region | 96,39% | 97,26% | 99,12% | 102,84% |
| Tver region | 91,63% | 91,66% | 92,80% | 94,39% |
| Tula region | 96,85% | 97,55% | 96,99% | 97,47% |
| Yaroslavl region | 89,16% | 89,80% | 87,41% | 90,74% |
| Moscow city | 88,76% | 88,08% | 87,62% | 88,66% |
| Northwestern Federal District | 87,18% | 87,02% | 86,96% | 88,18% |
| Republic of Karelia | 74,88% | 76,40% | 80,56% | 84,84% |
| Komi Republic | 76,38% | 76,42% | 76,04% | 79,07% |
| Arhangelsk region | 77,44% | 83,27% | 78,50% | 92,10% |
| Vologda Region | 98,10% | 99,44% | 99,78% | 96,26% |
| Kaliningrad region | 60,35% | 60,30% | 61,33% | 63,58% |
| Leningrad region | 86,10% | 86,65% | 88,89% | 88,67% |
| Murmansk region | 121,95% | 103,07% | 84,41% | 92,32% |
| Novgorod region | 95,84% | 94,71% | 97,65% | 94,57% |
| Pskov region | 89,14% | 88,10% | 90,66% | 94,10% |
| city of St. Petersburg | 87,73% | 87,57% | 87,56% | 88,73% |
| Nenets Autonomous Okrug | 147,56% | 140,38% | 154,60% | 126,77% |
| North Caucasian Federal District | 89,18% | 89,60% | 85,87% | 90,57% |
| The Republic of Dagestan | 83,16% | 84,26% | 84,24% | 84,89% |
| The Republic of Ingushetia | 93,28% | 93,81% | 93,30% | 99,02% |
| Kabardino-Balkarian Republic | 86,70% | 87,95% | 90,48% | 94,21% |
| Karachay-Cherkess Republic | 91,81% | 91,75% | 92,56% | 94,31% |
| Republic of North Ossetia-Alania | 88,48% | 89,38% | 89,15% | 87,62% |
| Chechen Republic | 97,47% | 100,11% | 66,44% | 100,40% |
| Stavropol region | 88,75% | 88,81% | 88,72% | 89,48% |
| Southern Federal District | 90,10% | 89,76% | 90,31% | 91,59% |
| Republic of Adygea | 85,74% | 86,11% | 86,69% | 86,78% |
| Republic of Kalmykia | 80,22% | 82,45% | 87,15% | 81,10% |
| Republic of Crimea | 85,70% | 86,23% | 86,95% | 89,73% |
| Krasnodar region | 90,74% | 90,76% | 91,30% | 93,21% |
| Astrakhan region | 65,85% | 64,39% | 60,28% | 58,65% |
| Volgograd region | 90,70% | 88,23% | 89,15% | 90,69% |
| Rostov region | 92,72% | 92,84% | 93,70% | 94,07% |
| city of Sevastopol | 81,26% | 81,25% | 81,10% | 82,99% |
| Volga Federal District | 86,26% | 85,60% | 81,02% | 86,79% |
| Republic of Bashkortostan | 91,04% | 89,38% | 90,28% | 90,53% |
| Mari El Republic | 88,36% | 88,19% | 89,24% | 90,19% |
| The Republic of Mordovia | 92,38% | 92,81% | 93,27% | 90,54% |
| Republic of Tatarstan | 87,88% | 87,56% | 87,38% | 88,48% |
| Udmurt republic | 79,95% | 79,29% | 79,71% | 81,95% |
| Chuvash Republic | 83,60% | 84,24% | 85,56% | 85,71% |
| Kirov region | 87,05% | 87,45% | 88,82% | 87,36% |
| Nizhny Novgorod Region | 88,99% | 88,96% | 63,08% | 88,59% |
| Orenburg region | 71,29% | 69,82% | 70,75% | 73,44% |
| Penza region | 91,13% | 90,95% | 90,54% | 91,12% |
| Perm region | 82,01% | 80,64% | 80,76% | 82,69% |
| Samara Region | 83,63% | 83,27% | 83,77% | 85,13% |
| Saratov region | 84,06% | 83,23% | 83,56% | 85,61% |
| Ulyanovsk region | 91,22% | 91,09% | 91,05% | 91,37% |
| Ural Federal District | 77,92% | 77,35% | 76,67% | 79,32% |
| Kurgan region | 85,43% | 84,69% | 86,21% | 88,07% |
| Sverdlovsk region | 91,64% | 91,50% | 91,20% | 91,40% |
| Tyumen region | 83,81% | 84,28% | 84,55% | 84,61% |
| Chelyabinsk region | 91,11% | 90,80% | 90,76% | 92,32% |
| Khanty-Mansi Autonomous Okrug - Yugra | 58,70% | 56,89% | 57,34% | 62,57% |
| Yamalo-Nenets Autonomous Okrug | 64,39% | 65,61% | 61,99% | 63,94% |
| Siberian Federal District | 84,16% | 84,22% | 84,50% | 85,56% |
| Altai Republic | 90,52% | 91,58% | 93,17% | 94,00% |
| Tyva Republic | 77,99% | 76,66% | 82,10% | 73,53% |
| The Republic of Khakassia | 89,66% | 89,94% | 90,09% | 92,13% |
| Altai region | 90,16% | 89,74% | 89,67% | 90,15% |
| Krasnoyarsk region | 78,06% | 79,53% | 80,66% | 83,04% |
| Irkutsk region | 77,06% | 77,21% | 77,83% | 78,88% |
| Kemerovo region - Kuzbass | 90,77% | 89,43% | 88,67% | 88,95% |
| Novosibirsk region | 89,51% | 89,55% | 89,83% | 90,25% |
| Omsk region | 88,27% | 88,51% | 89,06% | 90,73% |
| Tomsk region | 77,34% | 77,03% | 76,51% | 77,02% |
| Far Eastern Federal District | 96,97% | 95,85% | 94,96% | 95,86% |
| The Republic of Buryatia | 90,62% | 91,55% | 89,74% | 89,66% |
| The Republic of Sakha (Yakutia) | 90,67% | 89,68% | 86,76% | 87,16% |
| Primorsky Krai | 94,38% | 93,25% | 93,19% | 94,23% |
| Khabarovsk region | 92,91% | 91,97% | 91,61% | 94,62% |
| Amur region | 130,35% | 127,83% | 131,40% | 124,68% |
| Kamchatka Krai | 90,25% | 89,69% | 82,32% | 85,99% |
| Magadan Region | 97,54% | 98,80% | 95,29% | 91,23% |
| Sakhalin region | 98,33% | 96,99% | 93,92% | 89,72% |
| Transbaikal region | 89,50% | 87,29% | 87,42% | 90,06% |
| Jewish Autonomous Region | 86,78% | 90,63% | 105,64% | 112,00% |
| Chukotka Autonomous Okrug | 120,31% | 115,38% | 111,56% | 110,23% |
| BAIKONUR | 93,39% | 71,83% | 74,90% | 73,78% |
The current size of the average share of deductions can be calculated according to the 1-VAT report published on the website of the Federal Tax Service of Russia nalog.ru. The safe share of VAT deductions is calculated using the formula: Share of VAT deductions by region = Amount of VAT deductions (column 2100.1 of the 1-VAT report by region) / Tax accrued (column 1100.1 of the 1-VAT report by region) x 100%
For example, the figures for Moscow from the 1-VAT report as of 08/01/2019: 11 958 456 461 / 10 532 692 655 * 100% = 88,08%
Reason for checking
Exceeding the above values safe share deductions are fraught with an audit by the tax office. The Federal Tax Service explains this in its letter dated July 17, 2013 No. AS-4-2/12722.
The tax burden is an indicator calculated as the ratio of the amount of taxes paid by the taxpayer to the amount of his revenue according to the financial statements, multiplied by 100%. Each organization can calculate it independently using the formula:
Tax authorities, in turn, determine the tax burden coefficient by type of economic activity, i.e., a certain average value for each industry (clause 1 of the Publicly Available Criteria for Assessing GNP Risks, approved by Order of the Federal Tax Service of Russia dated May 30, 2007 N MM-3-06/333 @). And if it turns out that the level of workload in a particular organization is lower than the industry average, this may become the basis for including the company in the on-site inspection plan (clause 1, section 4 of the Concept of the GNP planning system, approved by Order of the Federal Tax Service of Russia dated May 30, 2007 N MM -3-06/333@, Letter of the Ministry of Finance of Russia dated June 23, 2016 N 03-02-08/36472). After all, this means that the organization pays less taxes (their share is a smaller part of its revenue) than other companies operating in the same field. Which raises certain suspicions among regulatory authorities.
As can be seen from the formula, insurance premiums are not included in the amount of taxes paid for the year (Letter of the Federal Tax Service of Russia dated March 22, 2013 N ED-3-3/1026@).
Indicators of the industry average tax burden
The tax burden by type of economic activity is in free access. The Federal Tax Service publishes them at the end of each year on its website no later than May 5 of the following year (clause 6 of Order of the Federal Tax Service of Russia dated May 30, 2007 N MM-3-06/333@). On this moment The document contains data for the period from 2006 to 2015. And the spread of values across industries is quite large: for 2015 - from 1.4% to 41.5%.
Tax burden indicators for specific taxes
Low level the burden for a specific tax (income tax, tax under the simplified tax system, etc.) may become a reason for selecting a taxpayer to the list of those whose activities are subject to review by the commission. Thus, the income tax burden is determined according to the income tax return as the ratio of the calculated tax to the amount of revenue and non-operating income, multiplied by 100%. If the obtained value is less than 3% (and for trade organizations - less than 1%), then the load level is considered low. This means that the company will be included in the “commission” list.
The tax burden for VAT is determined differently: as the ratio of the amount of VAT deductions for the previous 4 quarters to the amount of accrued VAT for the same period, multiplied by 100%. Here the load is considered low if the indicator value is 89% or more (
Articles on the topic